

Overview
Every March 1 the Colorado Dust-on-Snow Program (CODOS) likes to summarize dust-on-snow and snowpack conditions statewide and evaluate snow water equivalent (SWE) data with our eleven CODOS sample sites and place them within the framework of our Dust Enhanced Runoff Classification scheme (DERC). The intent is to offer a glimpse of plausible WY2025 springtime scenarios based on current snowpack and dust conditions compared to similar conditions in our period of record.
In putting the numbers together for this report there were more than a few times I had to double, and triple check what I was seeing; a number of SNOTEL stations in Southern Colorado showing percent of median values in the 40’s, 30’s, and even 20’s. There are a few stations in the green (within 10% of median) but not many, and taken as a whole the average is 61% in the Southwest Basins and 64% in the Upper Rio Grande. And when comparing analog years WY2018 reared it’s ugly head as a comparable year in the Rio Grande. That year saw a very shallow snowpack and significant dust-on-snow. In contrast, it is good to see the Northern Basins right near median levels while the Gunnison is sitting in the middle of the two extremes (79%).
On a positive note we have only received one mild dust-on-snow event this winter season that occurred the last days of January. The lack of dust events is also indicative of the lack of storms we have seen out of the Southwest, a direction that is most conducive for orographic precipitation for the San Juans. But at least for the time-being we don’t have much for impurities on the surface cranking up snowmelt even further over these recent hot days.
SNOWPACK CONDITIONS
We spent the middle of this winter talking to each other about how there wasn’t much to talk about in terms of the snowpack. A big end-of-October snowfall opened up ski lines around town that usually don’t come in until later in the season, which was exciting for some. Then the next storm cycle around the holidays brought some accumulation. Winds picked in the southwest, and we had some dust blow in end of January, but not much precipitation. Finally, Valentine’s Day delivered an atmospheric river event. Overall, we had a below-average January and February. Right as March 1st rolls around, we’re at 74% percent of average water year precipitation at Swamp Angel, even though our neighbor Red Mountain SNOTEL is at 92% percent of median (87% of average). Here's a more detailed look at how the months played out.
A Brief Monthly Summary
October 2024: We started the winter in a La Niña, which is projected to continue through spring. Extremely varied precipitation fell across the state of Colorado in October, and our southwest corner was on the high end of that variability. Lots of record warmest temperatures. It was an above average October for SASP, with 137 mm or 5.4” precipitation, about 157% of average dropping in the second half of the month. The first half was warm, but temperatures dropped as the storms rolled in. We had about 1.6 feet of snow accumulation and 4.49” of SWE at the end of the month.
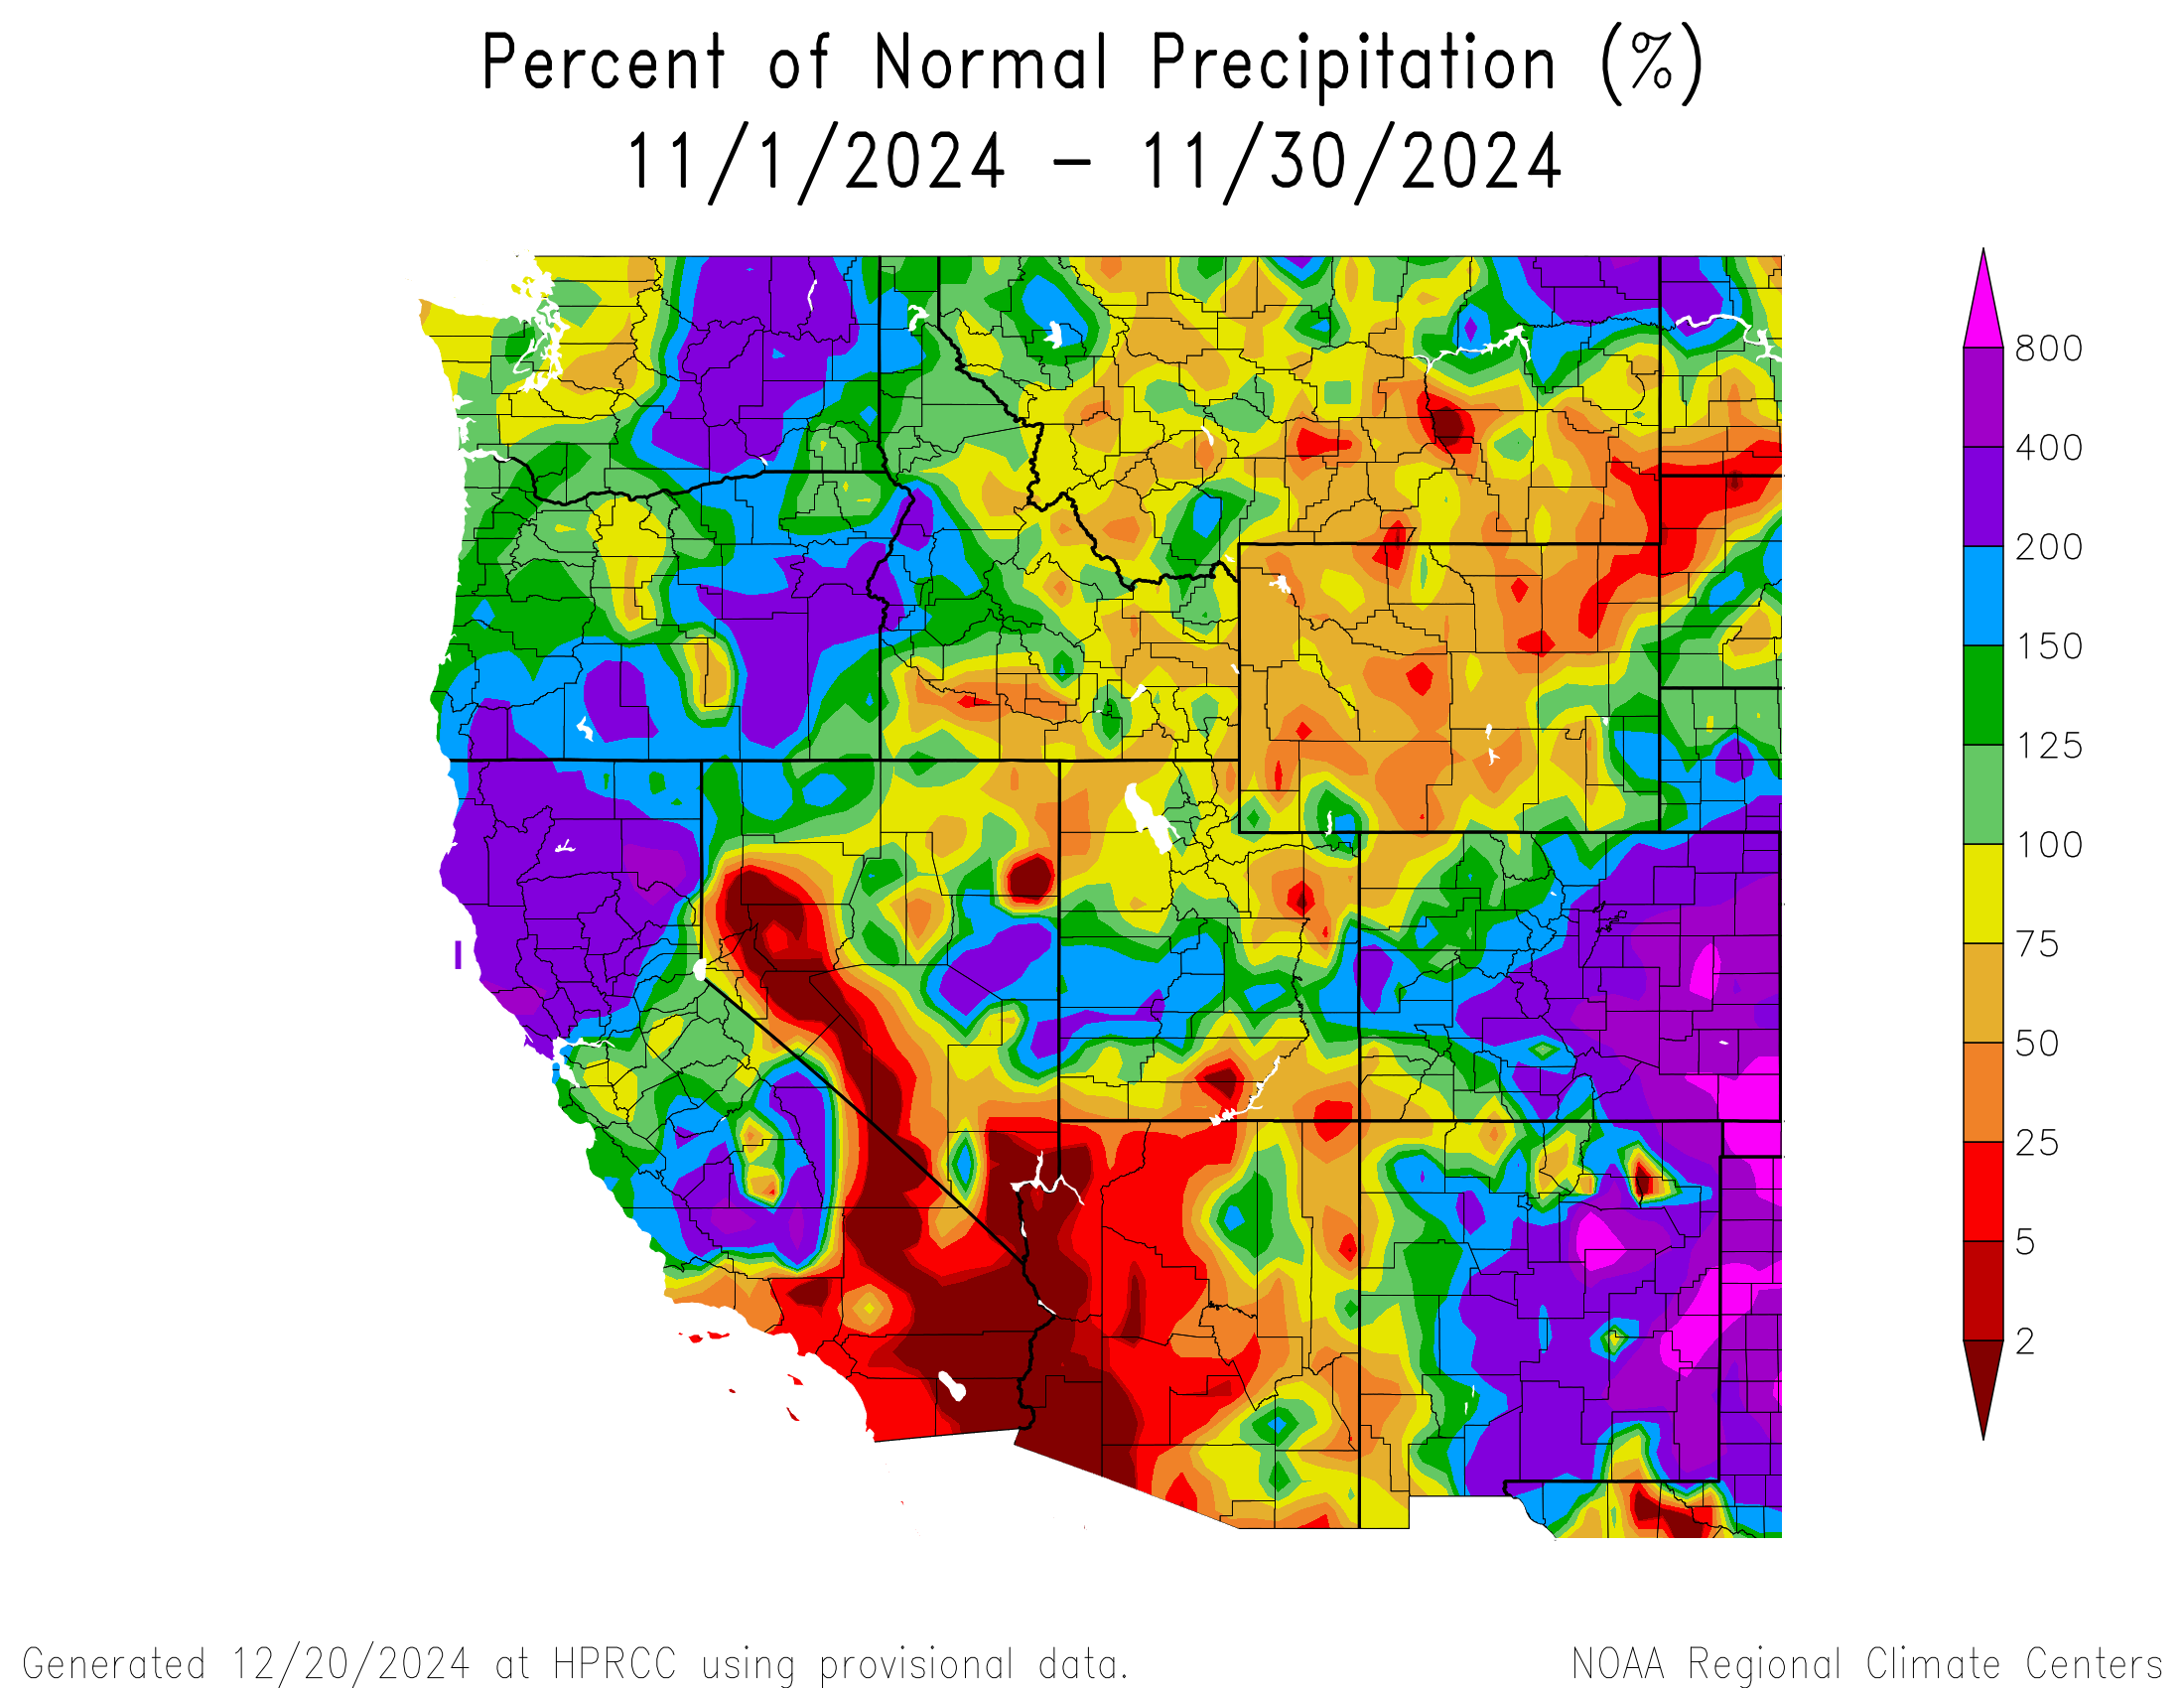
November 2024: November was another early season boon. Across Colorado, precipitation was above average (150%-400% of normal), combined with below average temperatures, -2 to -4 °F below normal for San Juan County. Swamp Angel Study Plot had two winter storms to tally, and the total precipitation for the month was 100 mm or 3.94”, which was about 112% of average. There were big temperature swings across the state. At Swampy, we had a minimum temperature of -0. 4 °F and a max temp of 45.5 °F. Just over a foot of snow accumulated.
December 2024: December was dry across the state – much below normal precipitation. In addition, very warm. We had flurries over the holidays, so folks got their snowy Christmas. Swamp Angel had two storms and a piddling monthly total of 67 mm or 2.6” of precip, only 54% percent of average December precipitation for our station. We ended December at about 268 mm or 10.6” snow water equivalent on the scale and 1.1 meters of depth.
January 2025: Very cold January – Arctic, one might say. There was a polar vortex that hit a bit of the state – during that time, temperatures in the town of Silverton dropped overnight to below -20 °F. Precipitation statewide turned out dry in the west and wet in the east. Swamp Angel collected 62 mm or 2.4” precipitation, which was disappointingly only 53% of average. We accumulated half a foot of snow depth, ending at 1.26 m depth and 328 mm or 12.9” snow water equivalent on the snow scale.
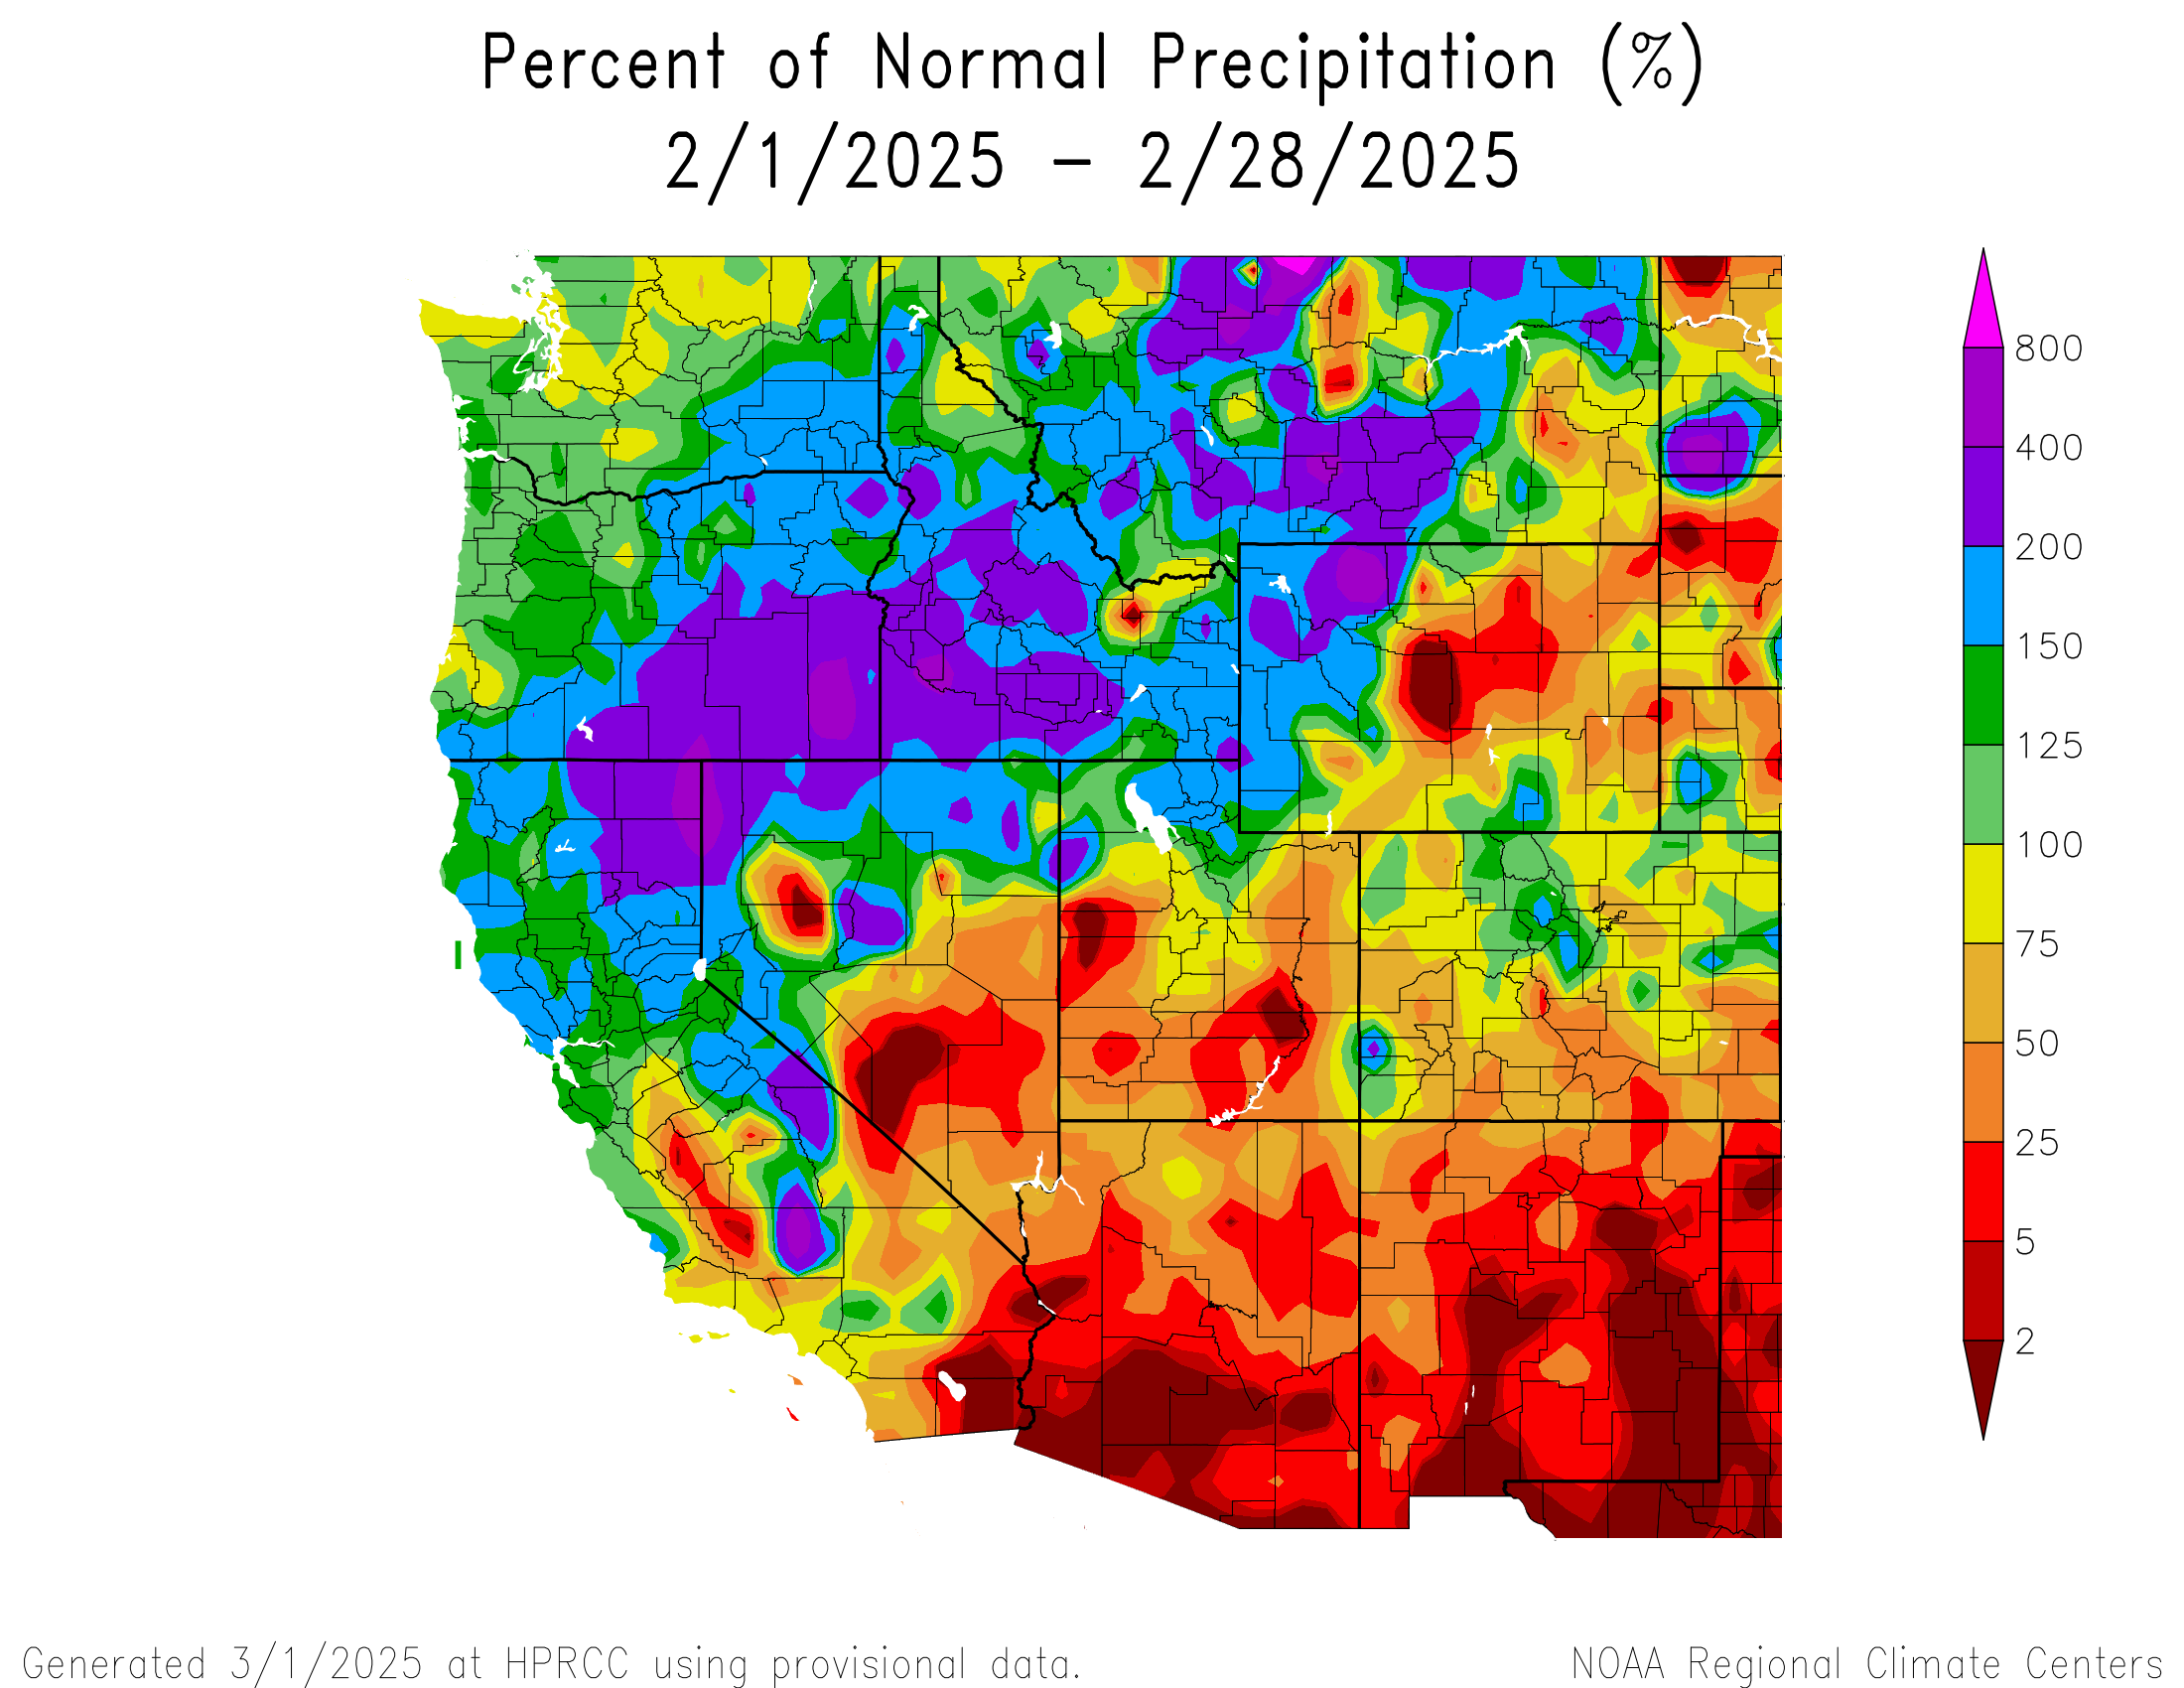
February 2025: It has been a bit of whiplash with February. Mostly, it has felt like springtime. The exception would be the big Valentine’s Day storm – big time pow, nearly 29” fell overnight at Swamp Angel. At Purgatory, it was too low angle to ski most runs. A brief, glorious bit of winter before back to solar crust and slush. We are transitioning to neutral ENSO conditions, so we are anxious to see how this spring plays out. Many higher elevation weather stations showed a big, record-setting heat spike at the beginning of February (see the SASP daily average temp plot below). The monthly minimum temperature at SASP was -6.3 °F, while the high was a beachy 45.6 °F. Swamp Angel scooped up 86 mm or 3.4” of precipitation, only 76% of normal. Snow water equivalent was about 415 mm to wrap up February.
A review of winter storms to date can be viewed on the storm reports page on our snowstudies.org website.
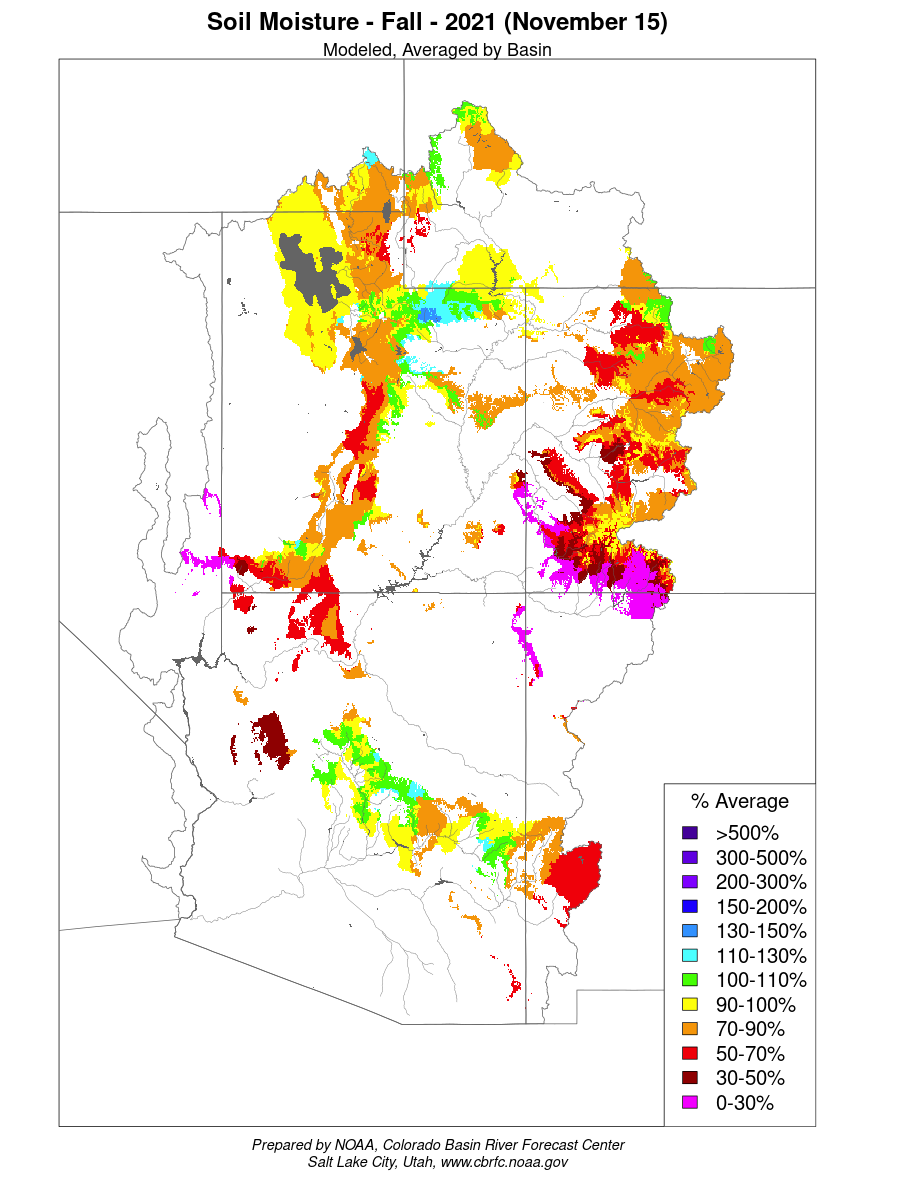
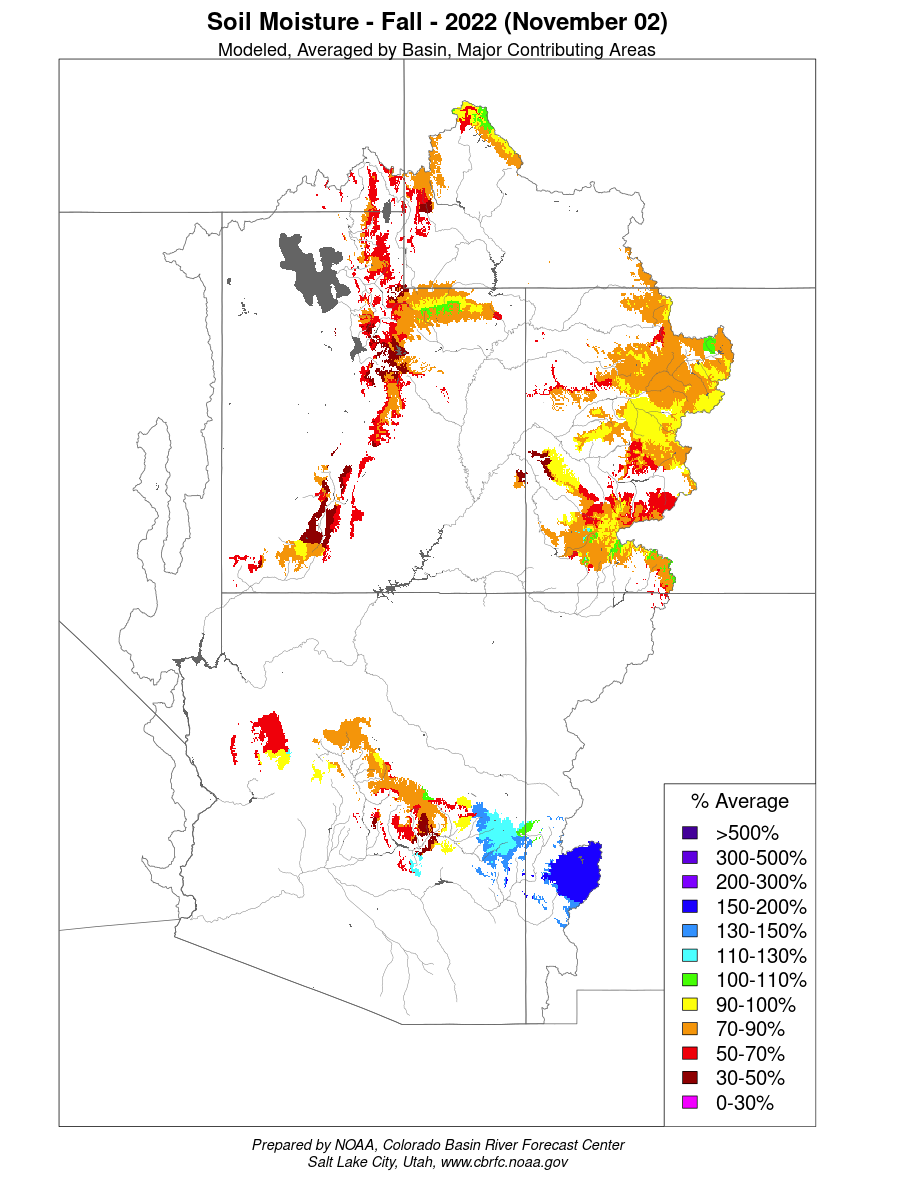
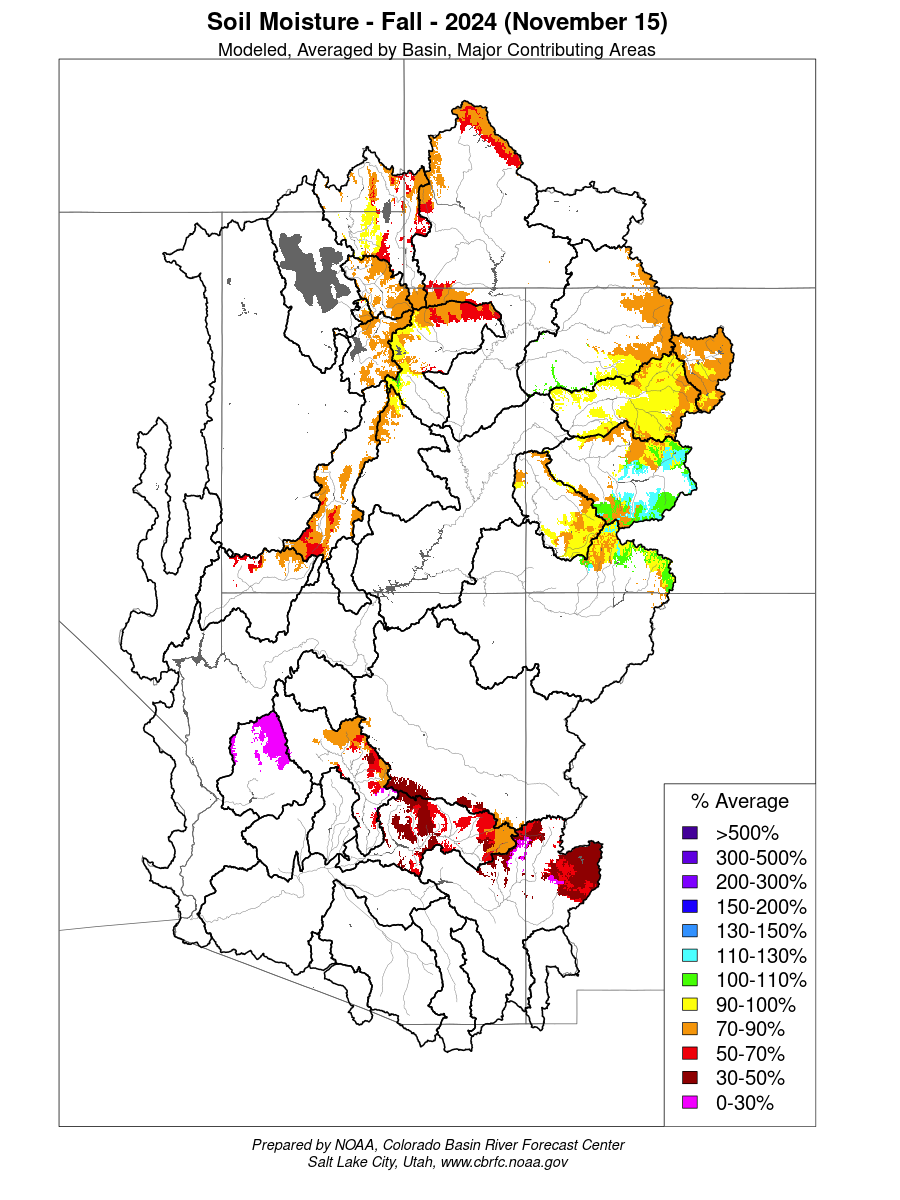
Below: CBRFC soil moisture map for the UCRB. Going into winter this past Autumn modeled soil moisture is slightly improved from last year going towards Southern Colorado and slightly worse going north. Soil moisture conditions help indicate runoff efficiency come runoff season since the first bucket to get filled when the snow melts is soil moisture.


Below: Swamp Angel study plot in Senator Beck Study Basin on Feb 22, 2025. You can see the dust event D1, the only event so far this season about midway down the snowpack.


Current DUST-ON-SNOW Conditions AND DERC CLASSIFICATION
Over the course of our 2005-2025 period of rigorous observations, March 1st has marked the beginning of the heart of “dust-on-snow season” for the Colorado Mountains (see the CODOS Dust Log chart of dust events by month). So far for WY2025 at Senator Beck Basin, the primary ‘sentry site’ for the CODOS program, we observed 1 dust event. This first event (dust event D1) occurred January 31, it was a mild event, very visible to the eye but pretty faint.
D1 is currently at the mid-point of the 5.7’ deep snowpack at Senator Beck Basin. With only this one mild dust event we are still in the “minimum” category in terms of overall dust severity in Southern Colorado and very likely farther north. The CODOS team will do our first statewide dust assessment of the season around mid-March.
DERC “Average” SWE equals median +/- 10%, and deviation above and below those limits are assessed as having “high” or “low” SWE. As of March 1st, SWE % is in the “average” category in the Upper CO/Yampa/South Platte/North Platte Basins and in the “low” category for the Gunnison/Arkansas/Upper Rio Grande/San Miquel, Dolores, Animas, San Juan River. The basins listed below are classified according to the appropriate DERC classification.
Basin scale WY 2025 March 1 SWE conditions (NRCS data) classified using the Dust Enhanced Runoff Classification Scheme.
As described on the CODOS website, the DERC framework is utilized to identify prior years with similar patterns of dust-on-snow intensity, March 1st SWE, and spring precipitation conditions, and their associated hydrographs. March 1st SWE analyses have been performed for each CODOS site. From this, hydrographs from 2006-2024 with associated March 1st SWE conditions have been identified and included in the analyses.
An ‘exploded view’ of the Dust Enhanced Runoff Space, separated by March 1 SWE classifications.
CODOS SITE-SPECIFIC ANALYSES

For individual SNOTEL stations associated with our eleven CODOS sites, March 1 SWE ranges from 38%-122% of median levels (using the new 1991-2020 metric). March 1 SWE conditions are classified by the SNOTEL station directly associated with each CODOS site, and also for select nearby SNOTEL stations. Prior seasons with similar March 1st conditions were identified and placed within the appropriate dust enhanced March 1st SWE space. Local watershed hydrographs (from 2006-2024) associated with those March 1st SWE conditions are presented as plausible examples of runoff behavior in spring 2025, with the understanding that these prior years exhibit a relative limited variety of 2006-2024 dust and spring precipitation conditions for each CODOS site.
These analyses are presented in PDF format and are available for the watersheds listed below. You can see the entire period-of-record hydrographs as it relates to dust conditions on our CODOS website.
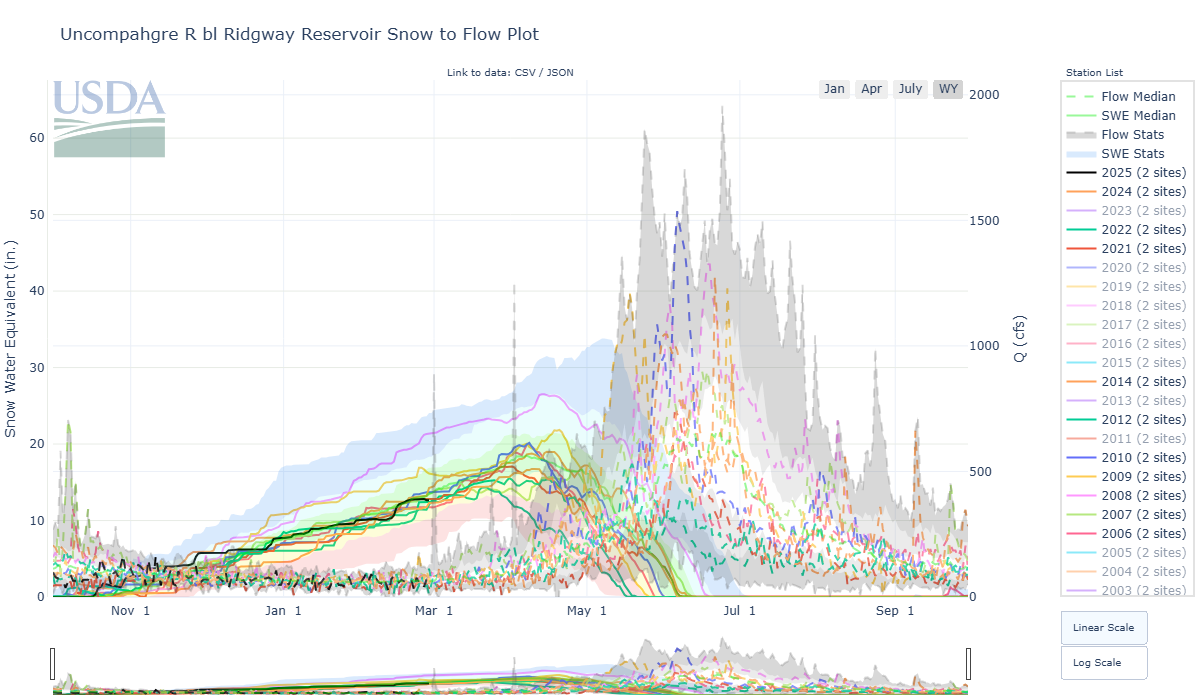
Below: In addition to the links to the pdf documents above the plots below show SWE and discharge for select watersheds for years with similar March 1 conditions. Explore this fun and convenient tool on your own by following this link.


comparitive water years
The possibilities are limitless on how we could see the remainder of the snow season unfold. Considering the DERC pdf’s above, the combinations of our three-legged DERC model (March 1 SWE, Dust Severity, Spring Weather) vary from basin to basin. See the DERC pdf’s and plots above for more information, but generally for the Yampa and Colorado Headwaters, the most relevant analog years are WY2024, WY2022, WY2026, WY2007. For the South Platte, WY2023, WY2022, WY2016 are plausible scenarios. In the Gunnison, WY2024, WY2021, WY2015, and WY2007 compare well. The Arkansas right now is best associated with WY2023, WY2013, WY2006. The Southwest Basins show WY2015 and WY2000 as a possible guide. Unfortunately, right now in Upper Rio Grande, WY2000 and WY2018 are what compare. WY2018 was a very dry and hot year and often was near or defined new lows in Basin SWE hydrograph, but on the other hand WY2000 had similar SWE at this point in the season but ended up touching median levels about a month later. So there is still hope for a turnaround, albeit the forecast is not looking overly wet. And lastly, for the Southwest Basins, there is variation within the sub-basins but overall the comparative year is WY2015 (although the chances of getting a miracle May is remote), WY2018, and WY2000.
SENATOR BECK STUDY BASIN (SBB) DATA PLOTS
SBB is located at, or near, the headwaters of four major watersheds (Animas, Uncompahgre, San Miguel, and Rio Grande) and is the only high alpine study site in the region collecting comprehensive snowpack and information. We regularly dig snow profiles to assess snow/dust conditions, and our meteorological stations measure the entire energy balance of the snowpack. Being a headwater study basin, the elevations that we collect snowpack information and continue meteorological station monitoring is well above the highest of most SNOTEL stations.


Above: YTD precipitation values on March 1, April 1, and May 1. The trend is not looking promising with recent years showing less snow on March 1, about 4” less, than the early years when we installed the precipitation gauge and began collecting data in 2004.


Below: Colorado will be leaning towards wetter than normal conditions over the next couple weeks. Air temperatures are forecasted to be near normal or above.


Below: CODOS tour map. These locations are visited in March, April, and May to assess dust-in-snow conditions.

SENATOR BECK STUDY BASIN SETTING
Usually just before spring it is helpful to remind long-time CODOS subscribers and inform new subscribers where Senator Beck Basin (SBB) and it’s meteorological stations are located, so when we refer to data at SASP (Swamp Angel Study Plot) or SBSP (Senator Beck Study Plot) the reader understands the environment in which it was collected.
Senator Beck Study Basin location near Red Mountain Pass near Silverton, CO. Elevation of the Basin ranges from 11,030’ at the stream gauge to 13,510’ at the crest of the peaks. The blue line delineates watershed boundary. Senator Beck Study Plot and Swamp Angel Study Plot are the locations of highly instrumented meteorological stations and are also where snowpack data is collected. This picture was taken from our Putney station, where we collect “free air” wind speed and direction.
