


Senator Beck Basin
Primary Sentry Site for the CODOS Program
Elevation: 11,060' (Swamp Angel)
Latitude: 37°54'25.30"N
Longitude: 107°42'40.23"W
Slope: 3° Aspect: NE
Adjoining Watersheds: Uncompahgre, Animas, San Miguel, Dolores
Associated Snotels: Red Mountain Pass, Lizard Head Pass
Senator Beck Basin
Primary Sentry Site for the CODOS Program
Elevation: 11,060' (Swamp Angel)
Latitude: 37°54'25.30"N
Longitude: 107°42'40.23"W
Slope: 3° Aspect: NE
Adjoining Watersheds: Uncompahgre, Animas, San Miguel, Dolores
Associated Snotels: Red Mountain Pass, Lizard Head Pass
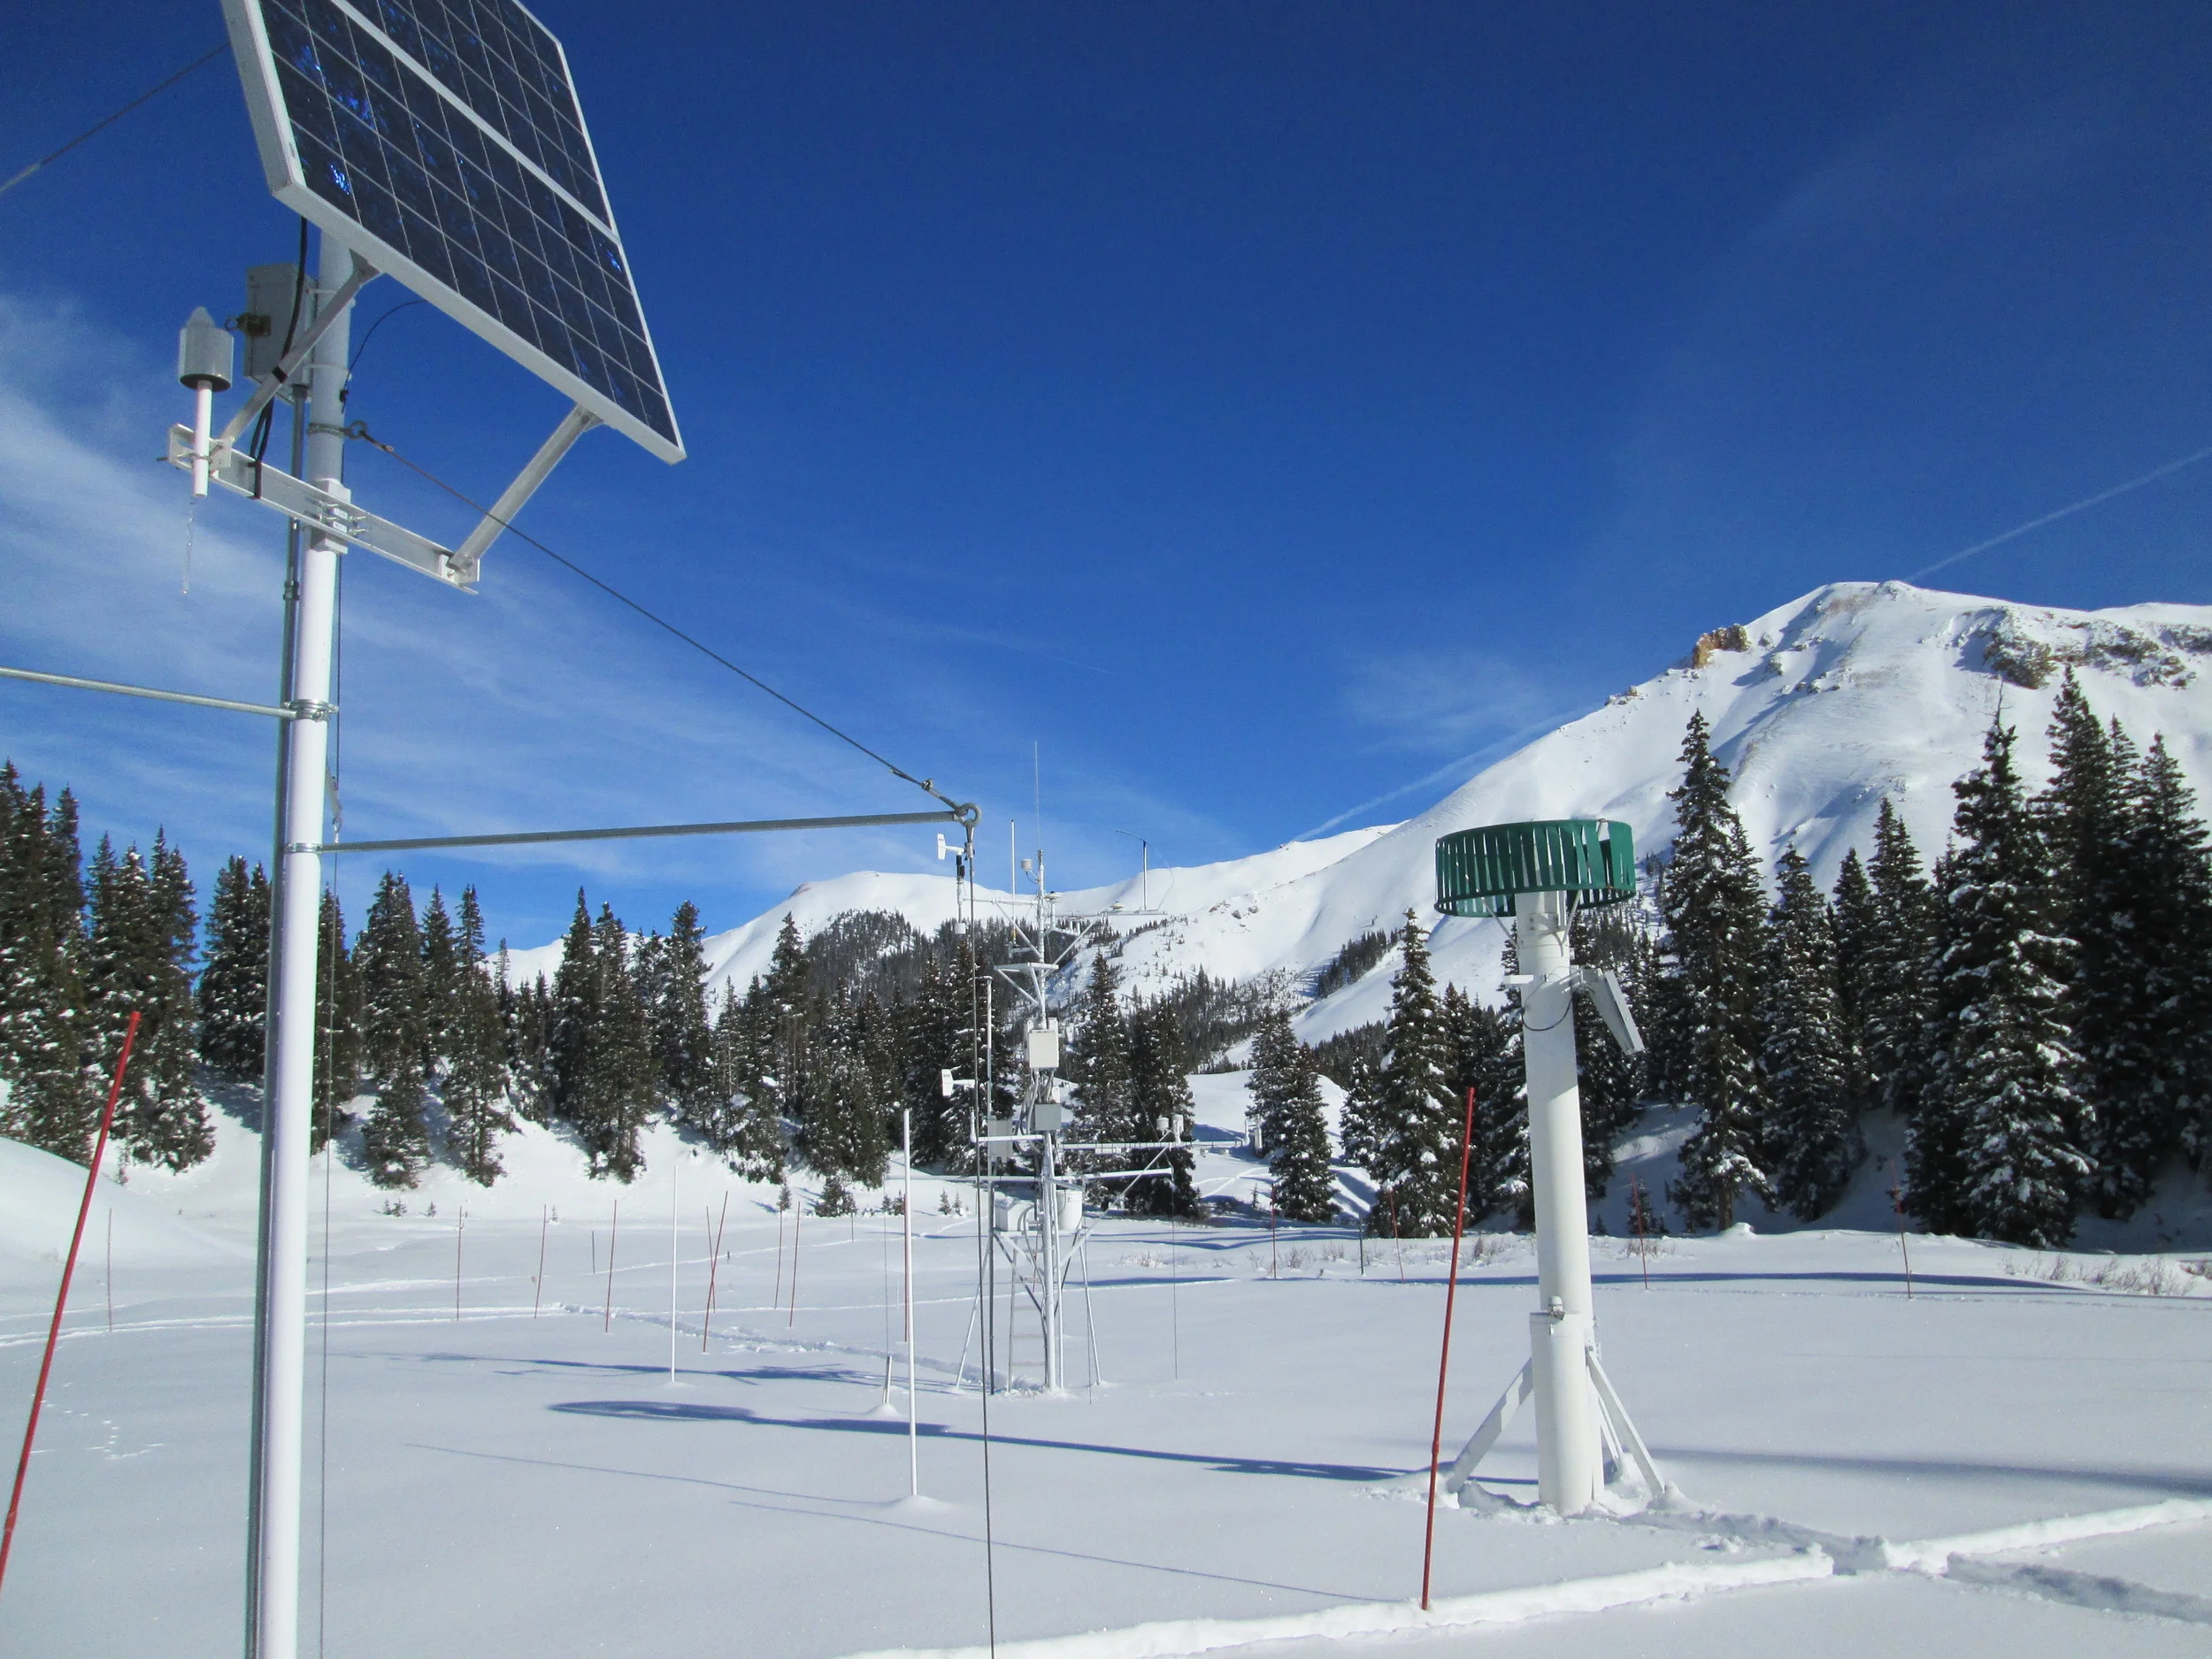
Senator Beck Basin (SBB) CODOS Reference & Archives
Swamp Angel Study Plot, November 27, 2013
See CODOS Updates & Alerts for state-wide and general dust-related posts. For more about Senator Beck Basin, see snowstudies.org.
Dust Enhanced Runoff Classification
Dust Enhanced Runoff Classification
CODOS has now observed eleven seasons of dust-enhanced snowmelt runoff behavior throughout the Colorado mountains (WY 2006-2018). Hydrographs at headwater stream gauges have been evaluated and classified within the framework of this dust enhanced snowmelt runoff space utilizing a 3 x 3 x 3 cell matrix corresponding to general characterizations of SWE, dust intensity, and spring weather, as shown in this figure.
A conceptual dust enhanced snowmelt runoff model integrating the interactions of March 1 SWE, dust intensity, and spring precipitation.
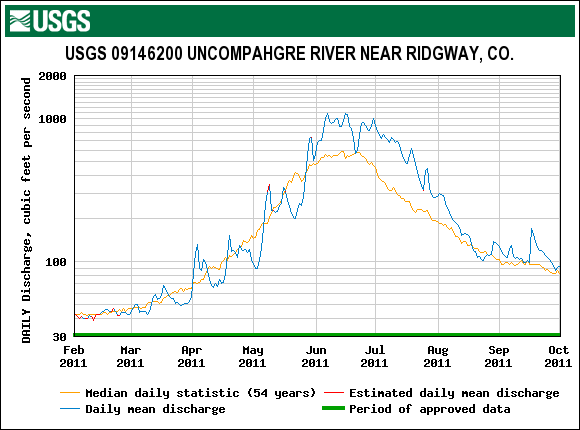
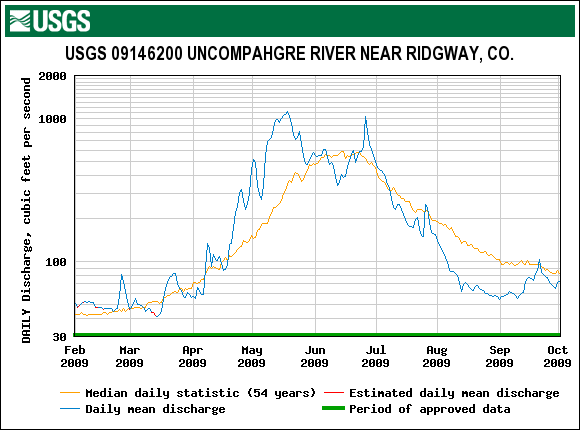
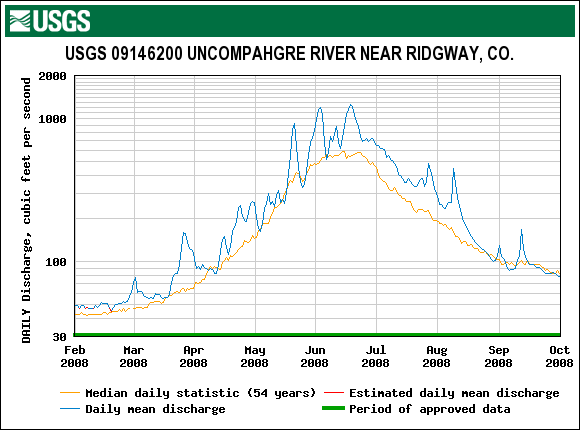
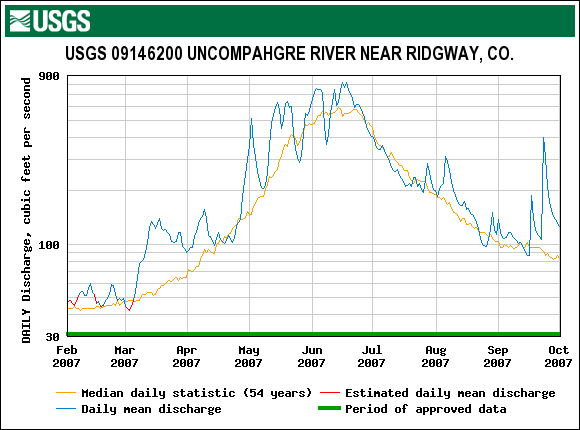
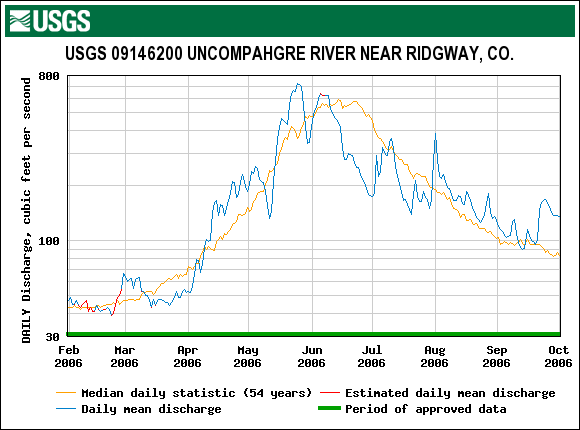
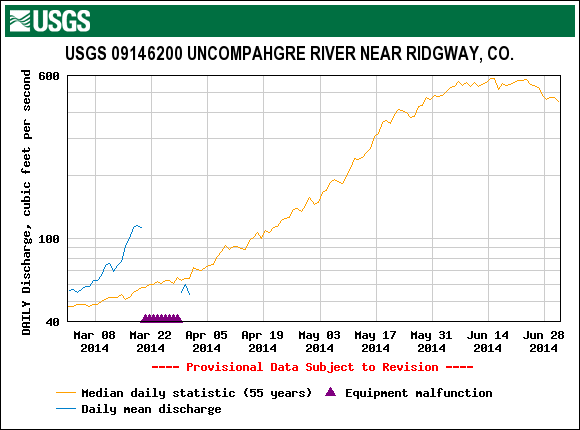
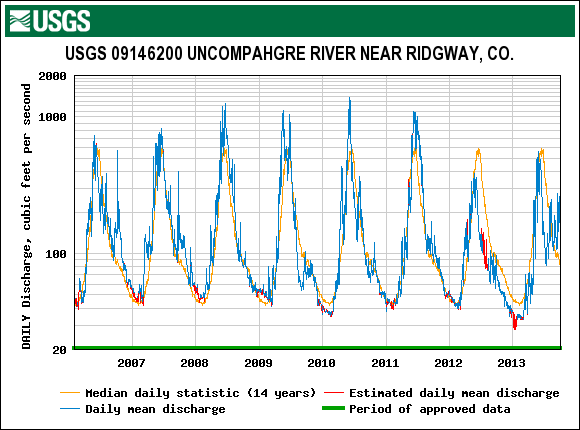
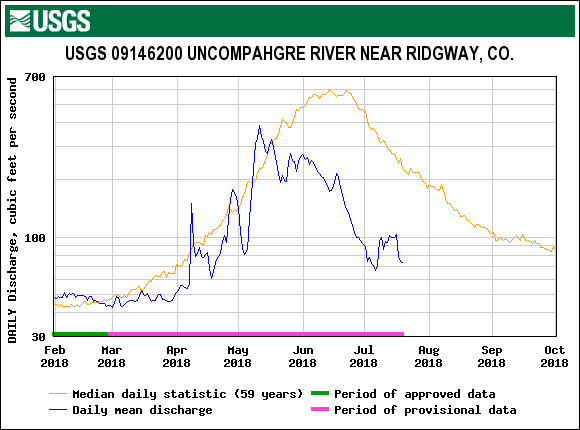
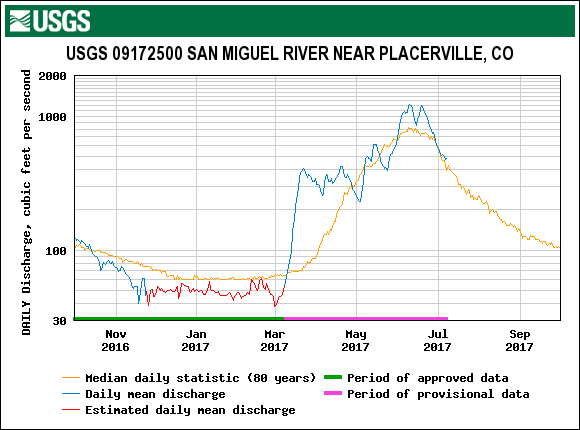
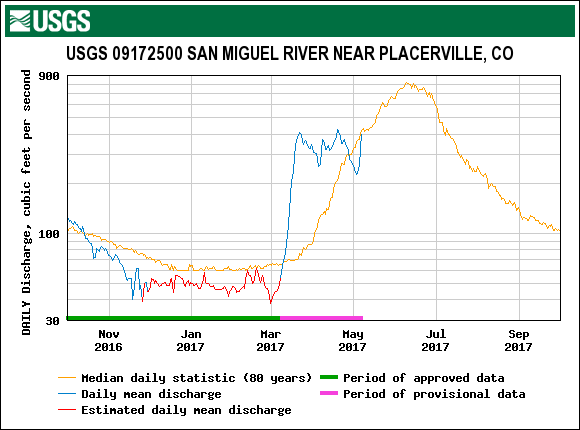
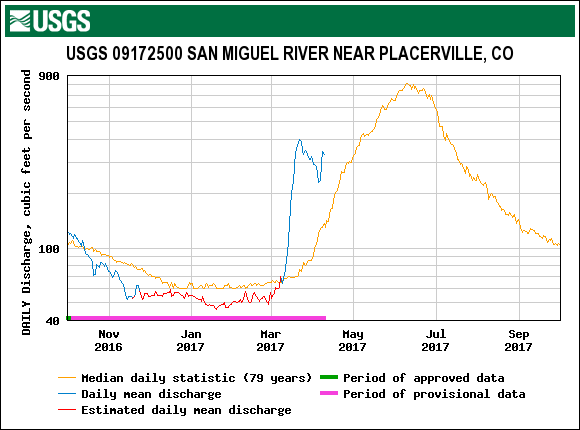
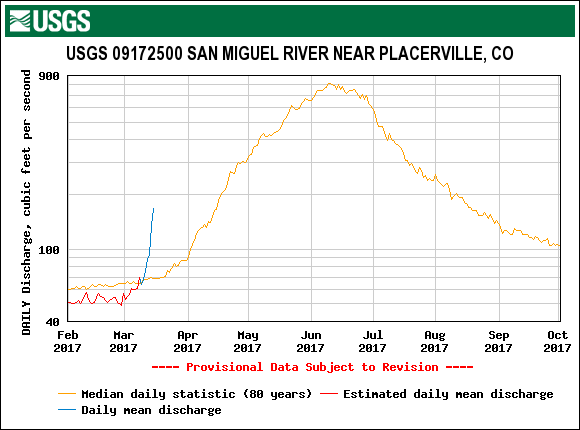
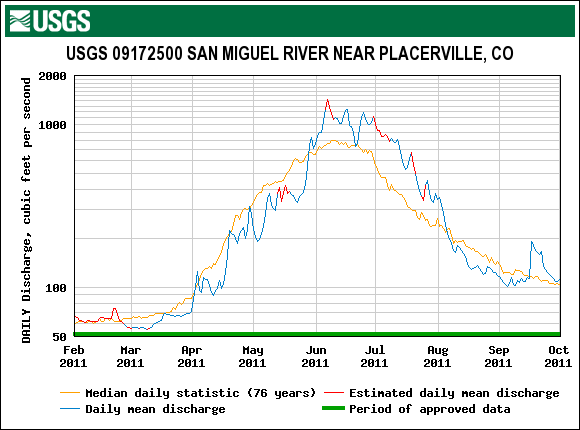
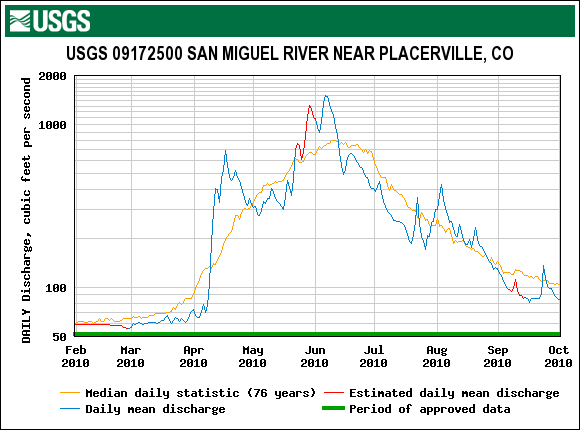
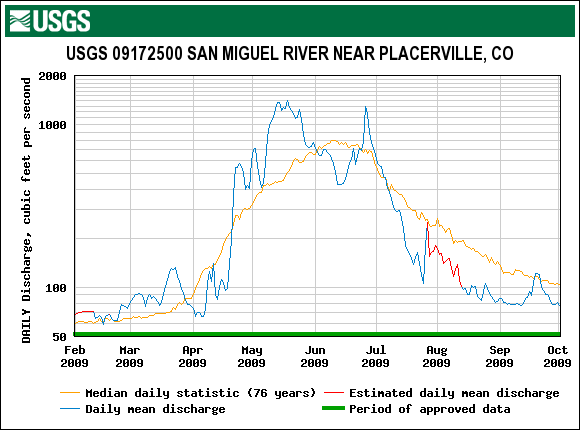
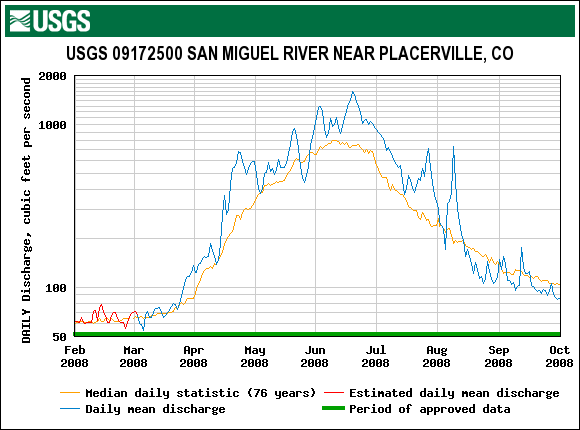
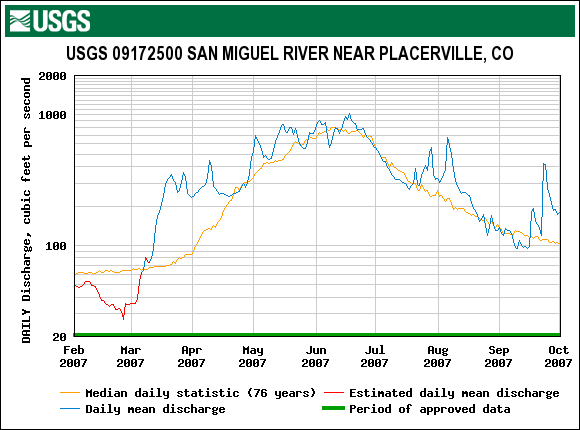
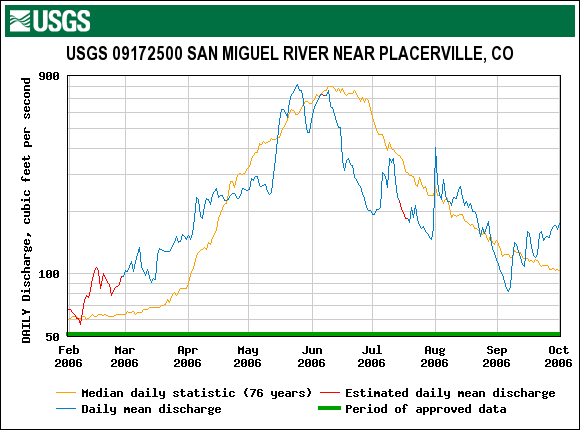
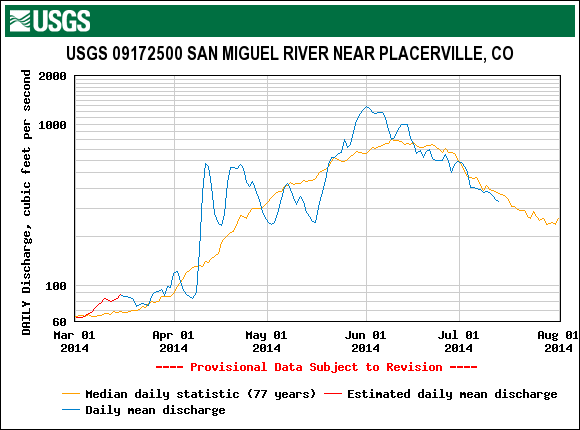
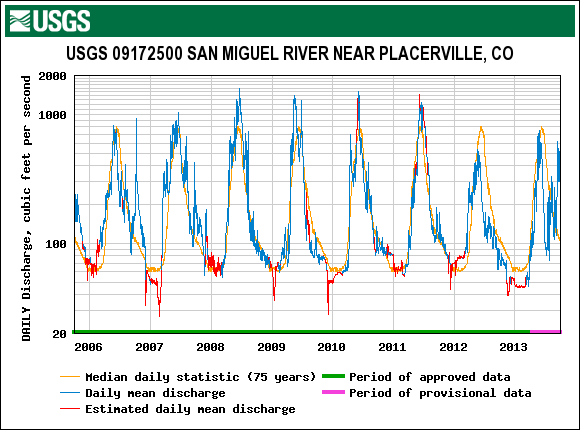
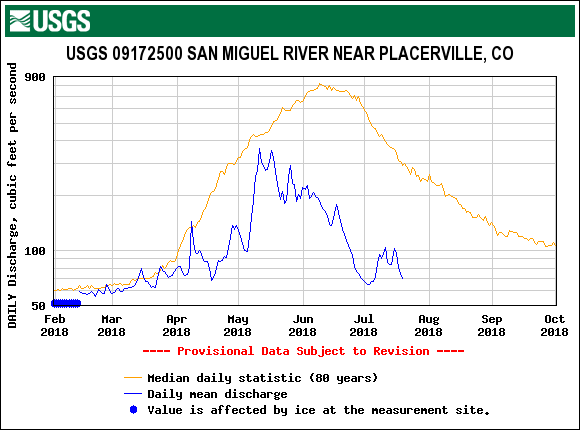
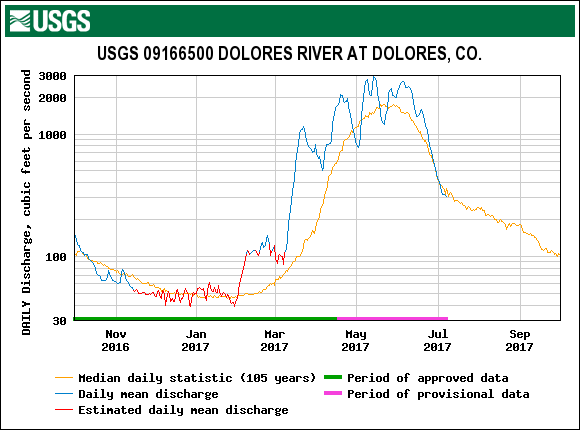
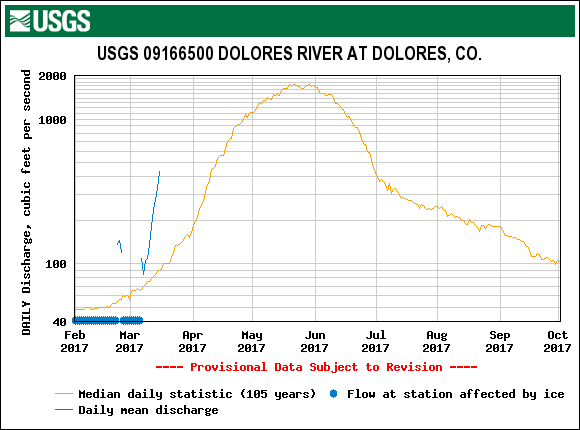
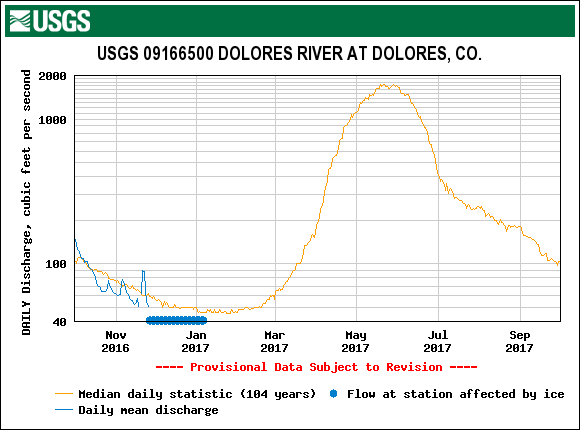
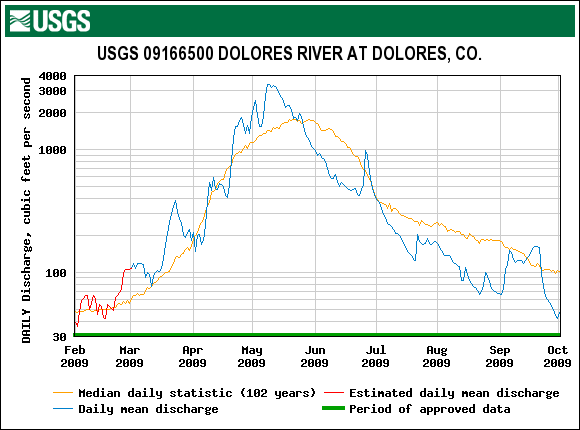
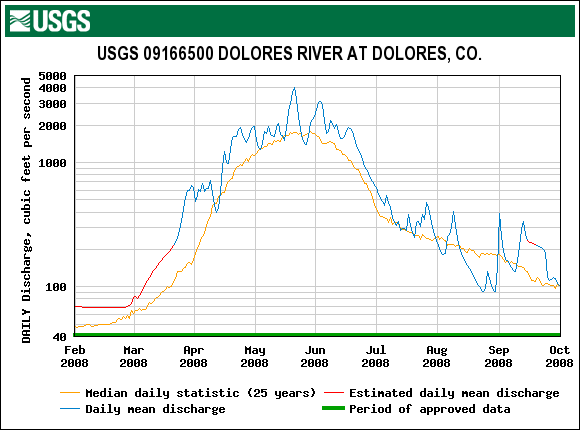
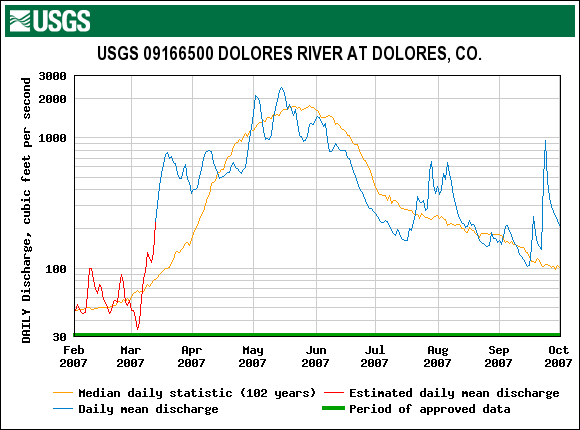
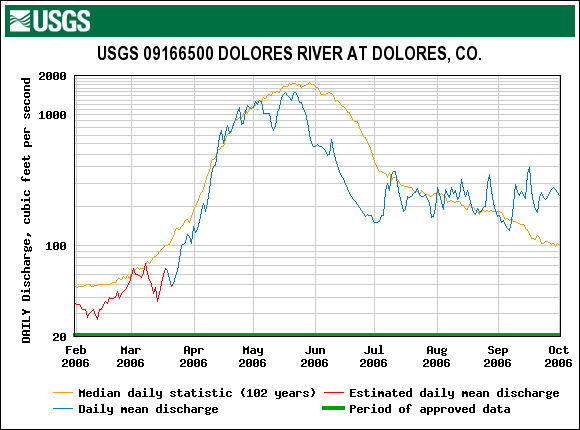
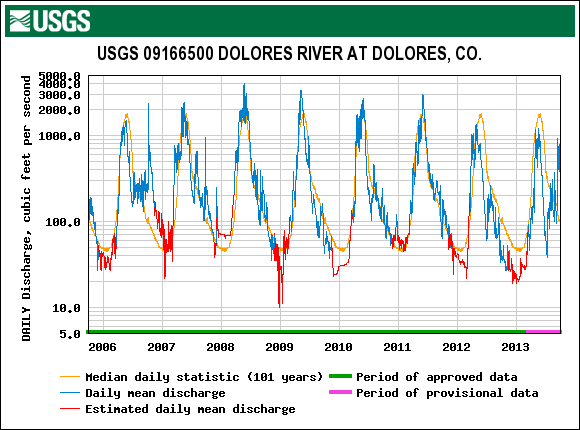
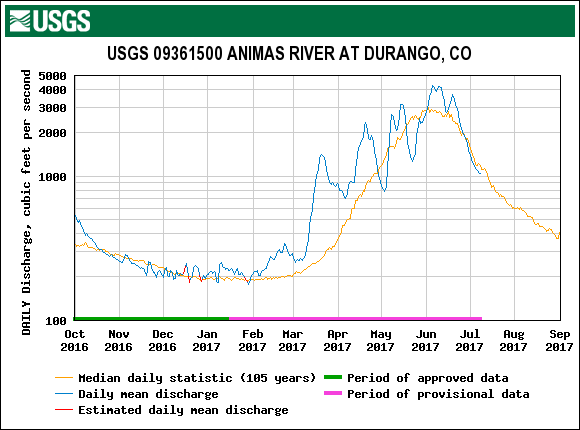
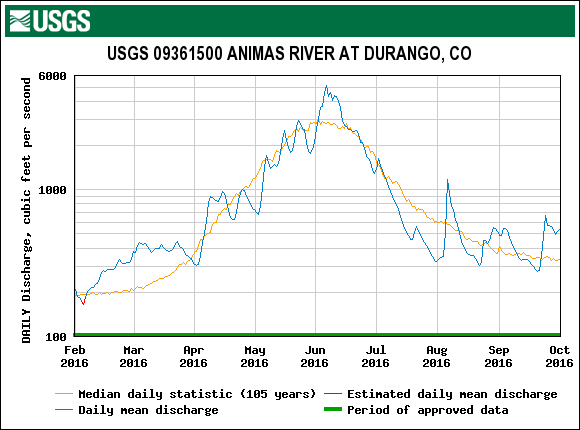
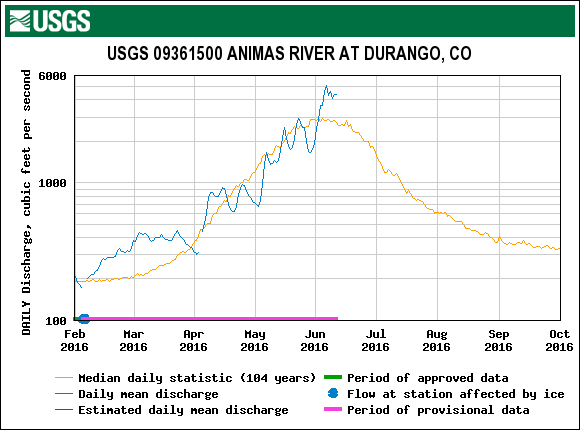
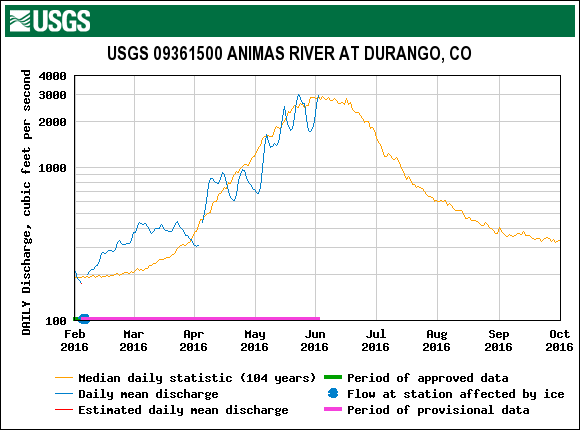
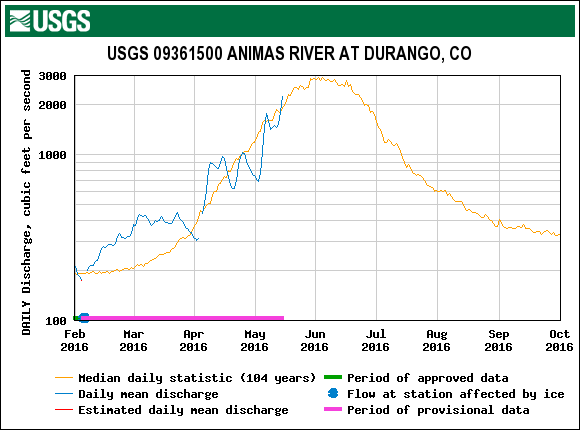
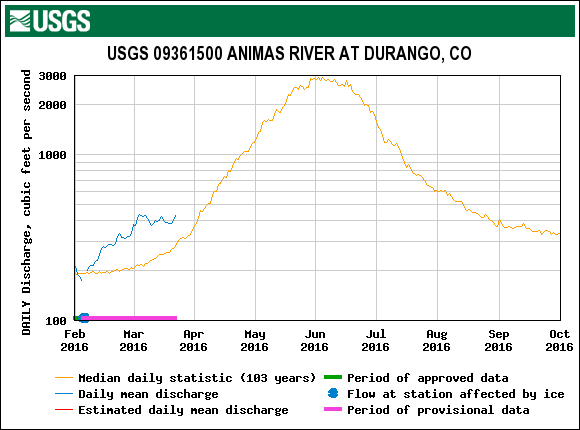
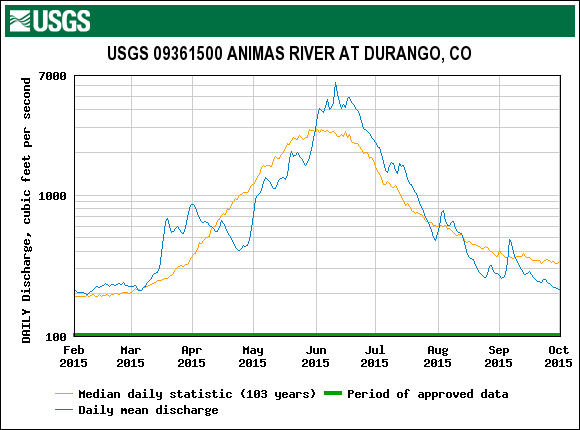
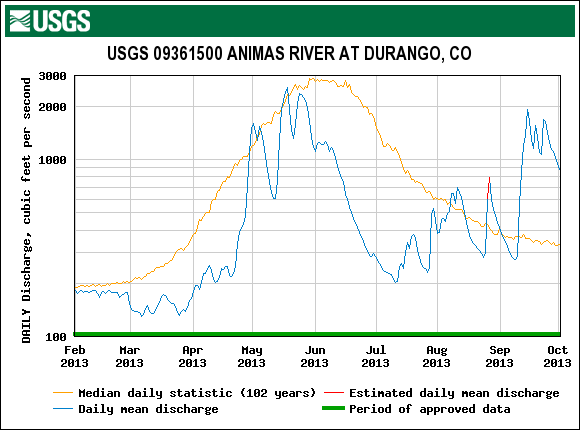
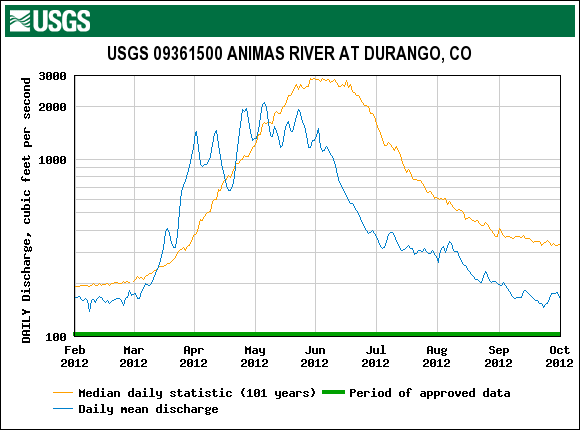
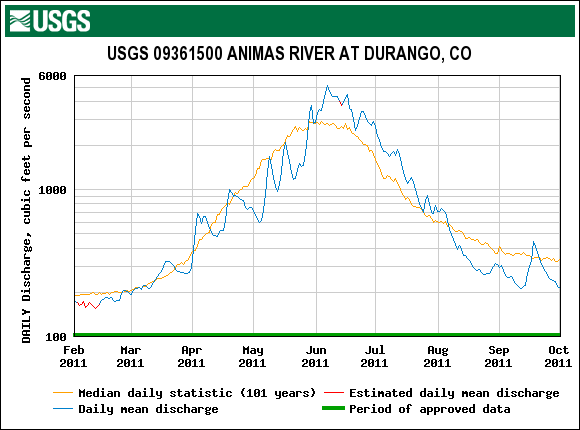
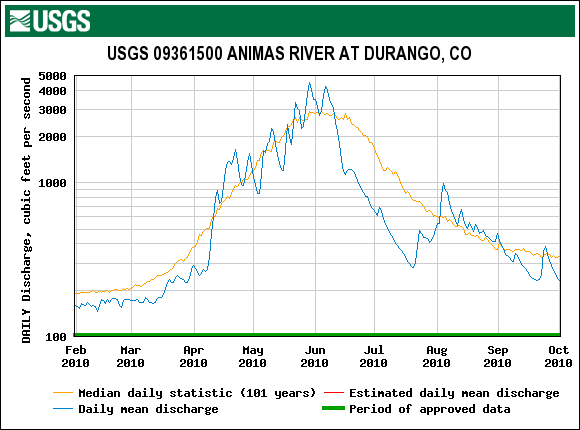
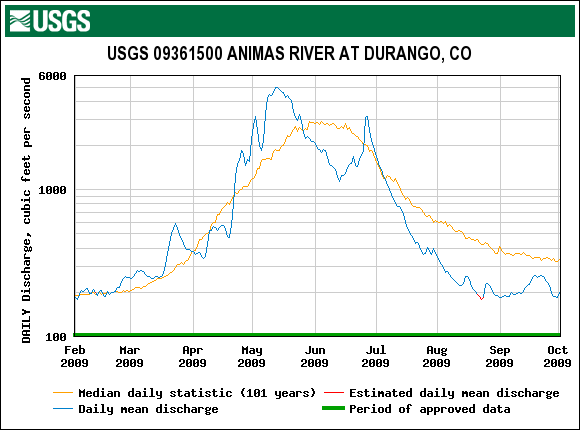
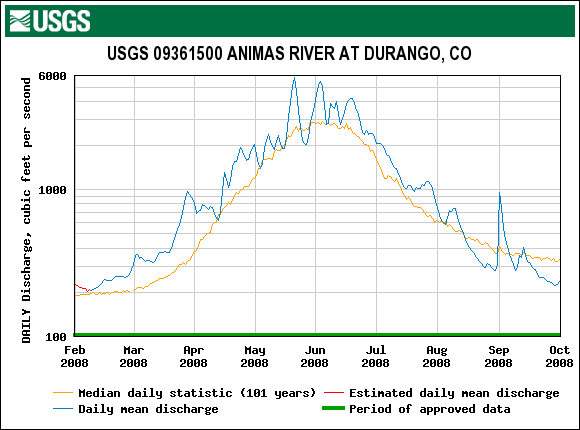
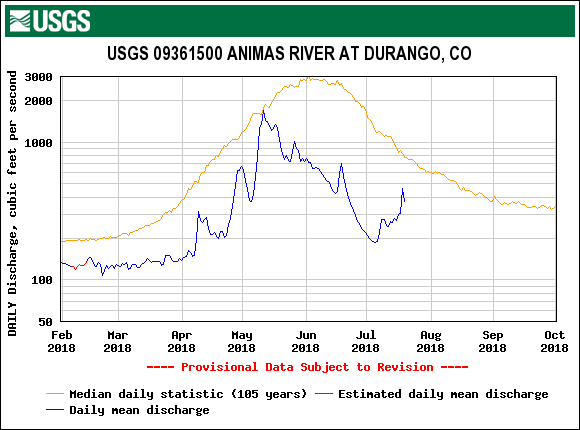
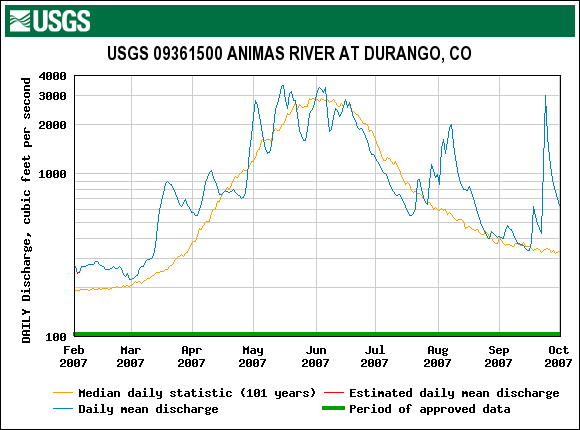
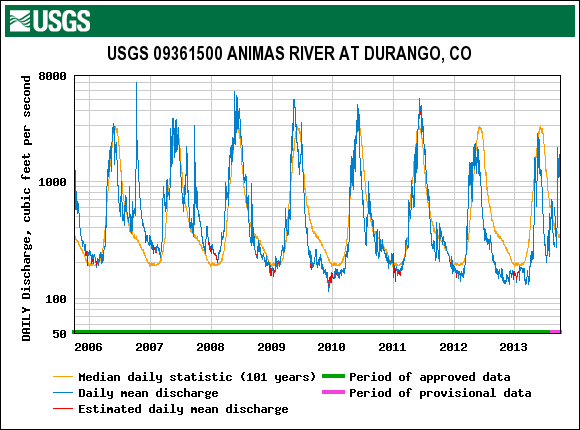
Water Years 2006-2018 have been analyzed and classified for the following stream gauges associated with the Senator Beck Basin CODOS site:
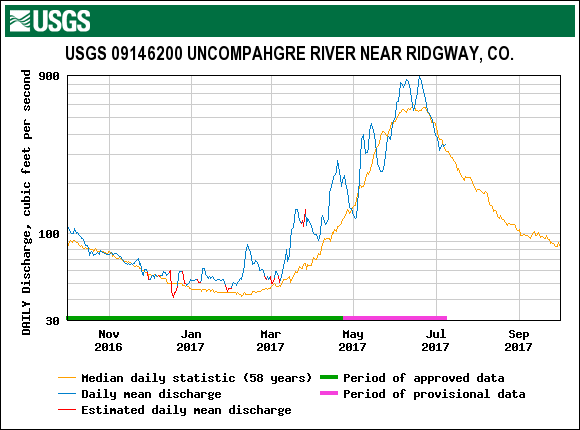
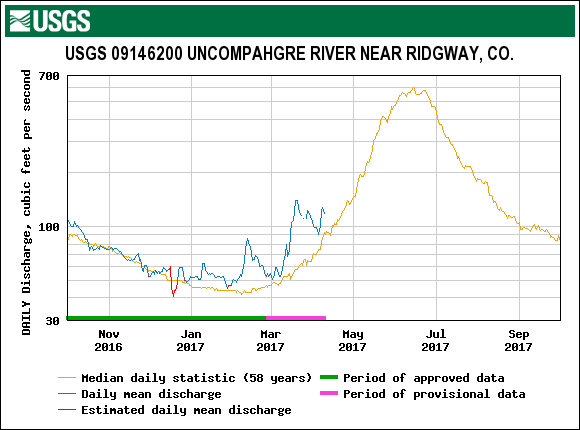
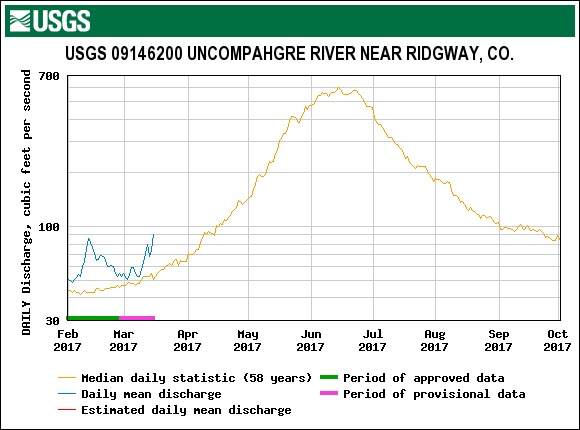
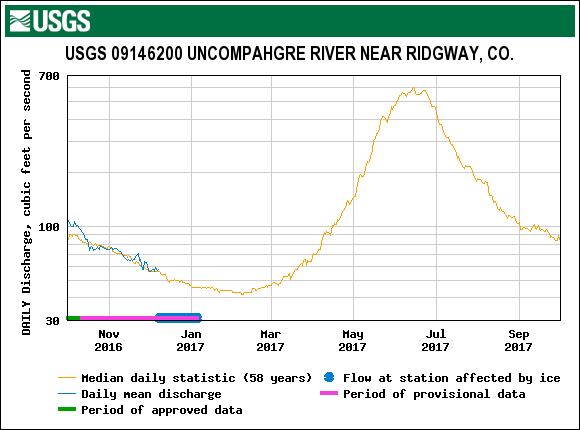
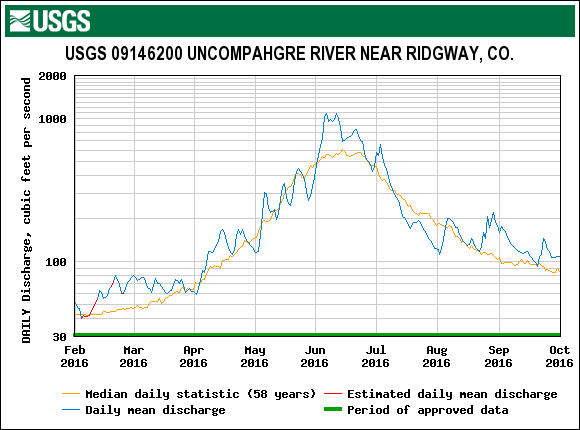
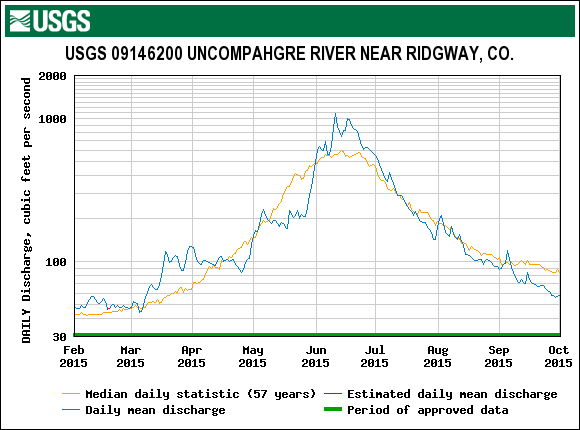
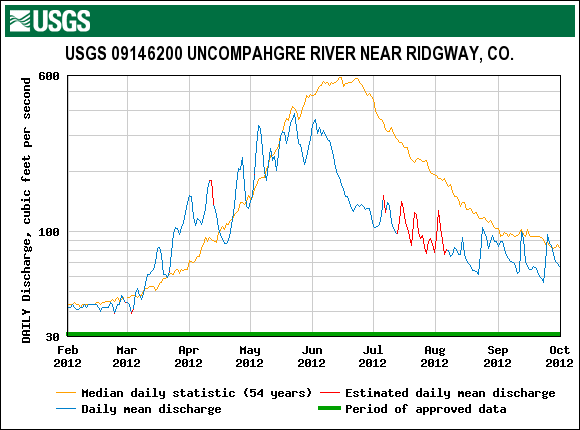
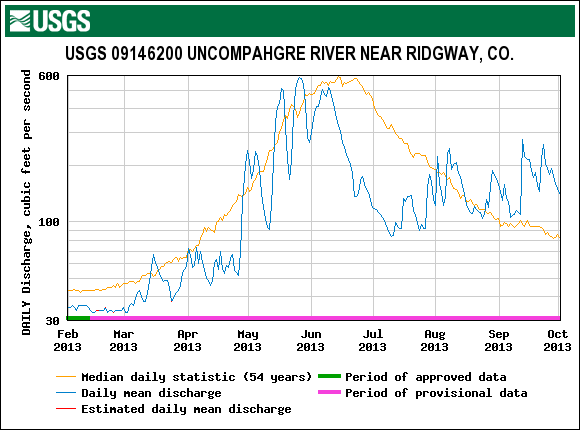
Animas River at Durango (pdf)Dolores River at Dolores (pdf)San Miguel near Placerville (pdf)Uncompahgre near Ridgway (pdf)
For a detailed discussion of this approach, see the state-wide Dust Enhanced Runoff Classification section.
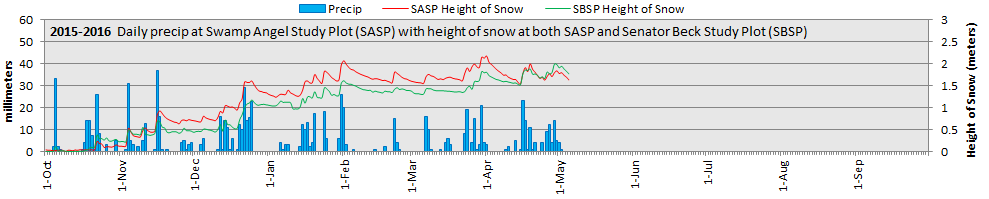
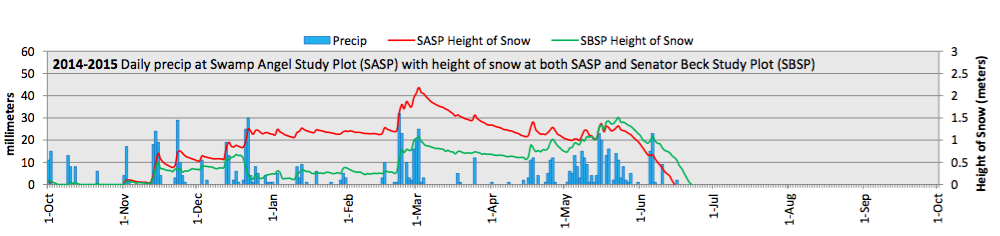
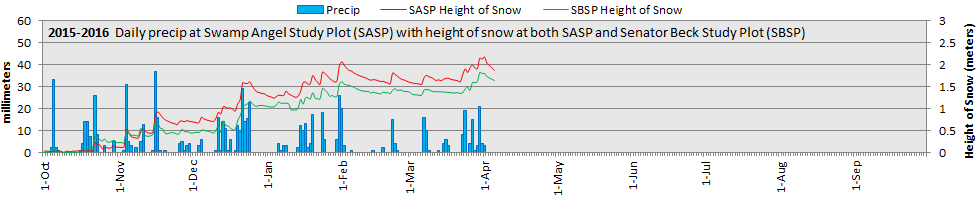
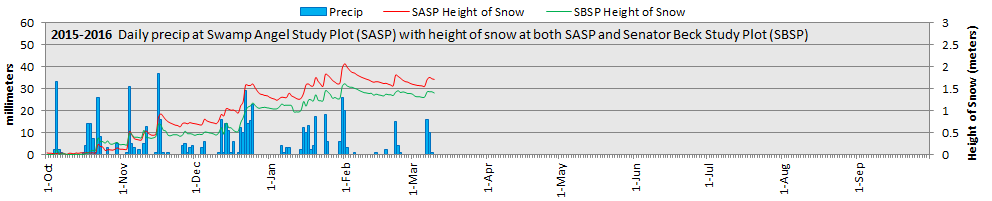
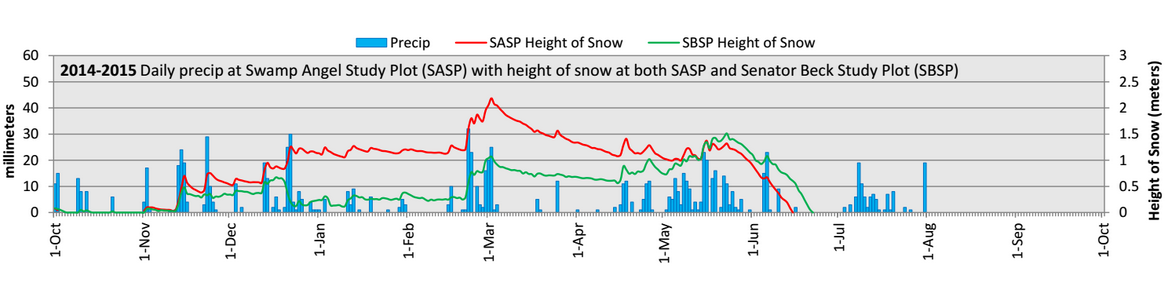
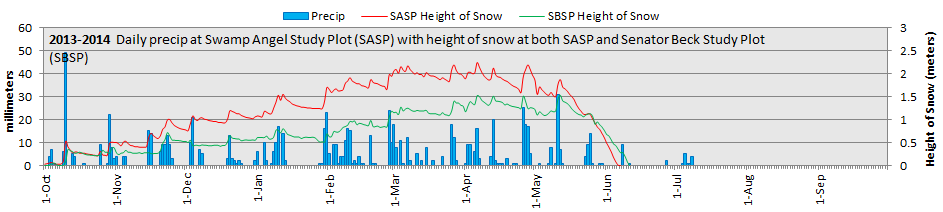
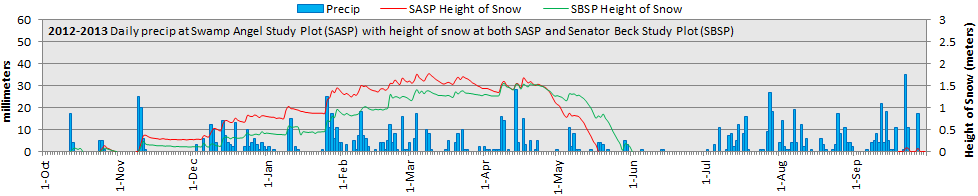
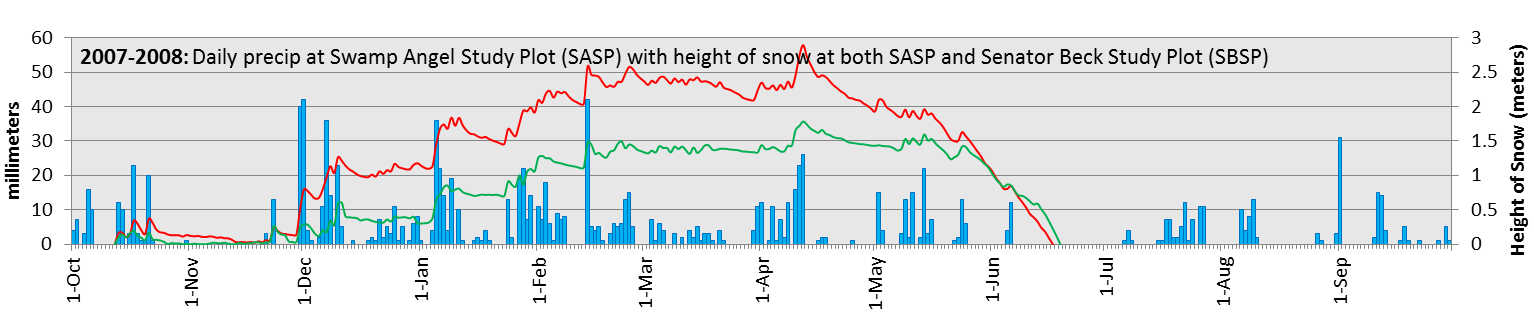
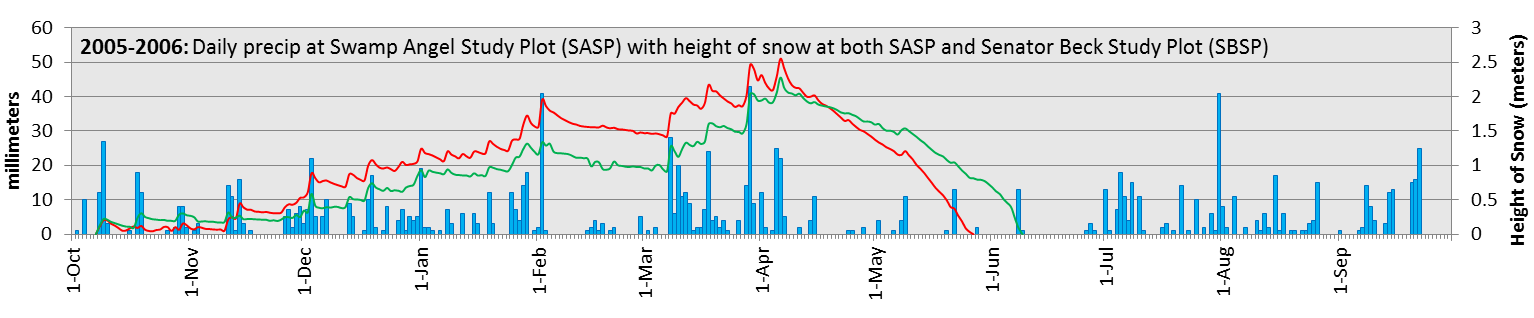
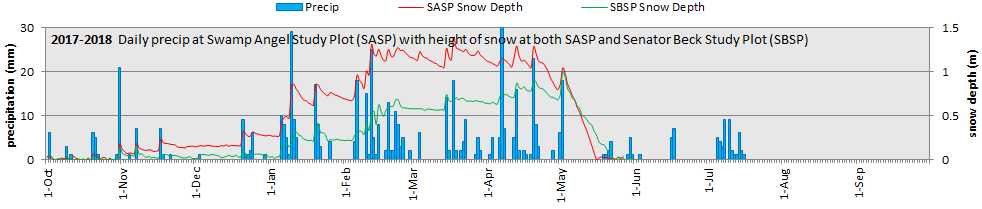
March, April, May Precipitation
March, April, May Precipitation
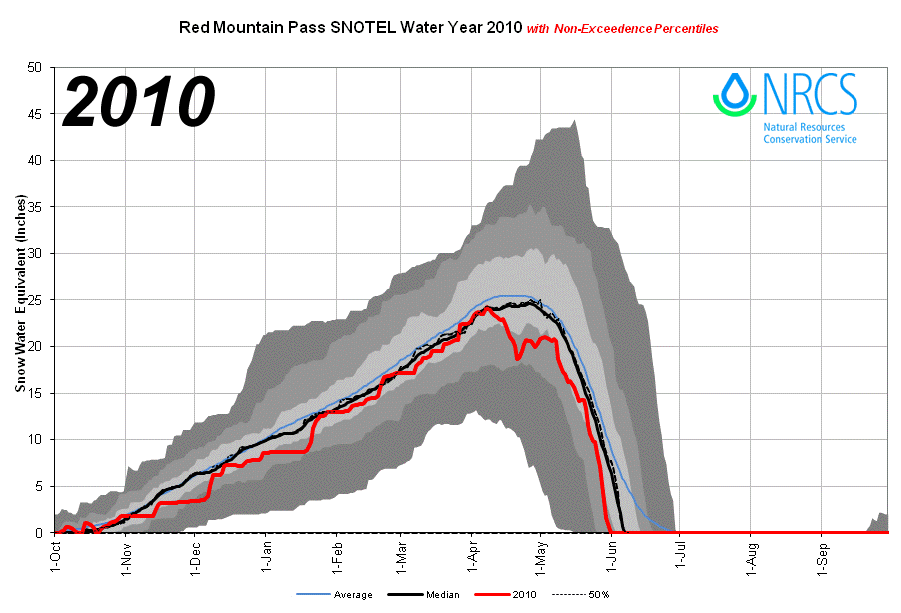
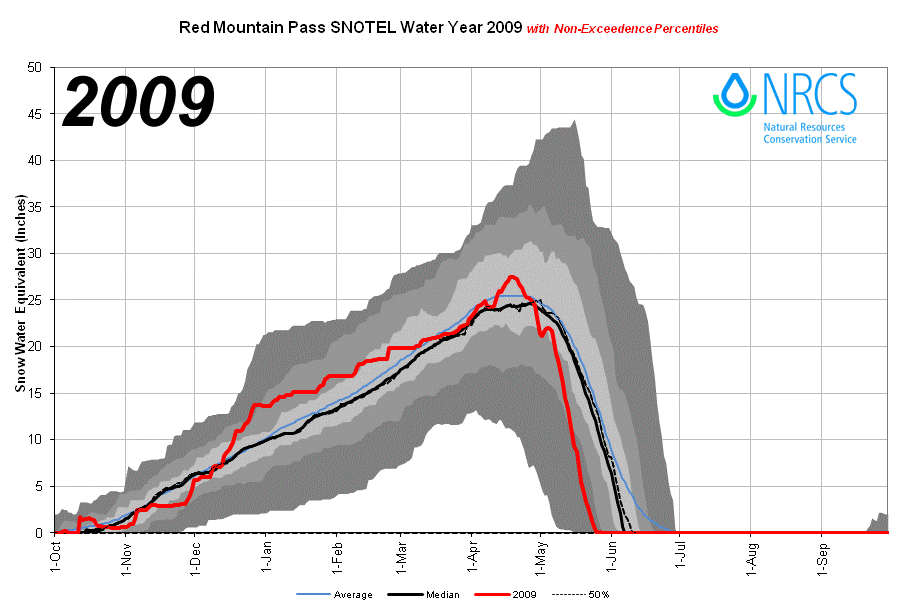
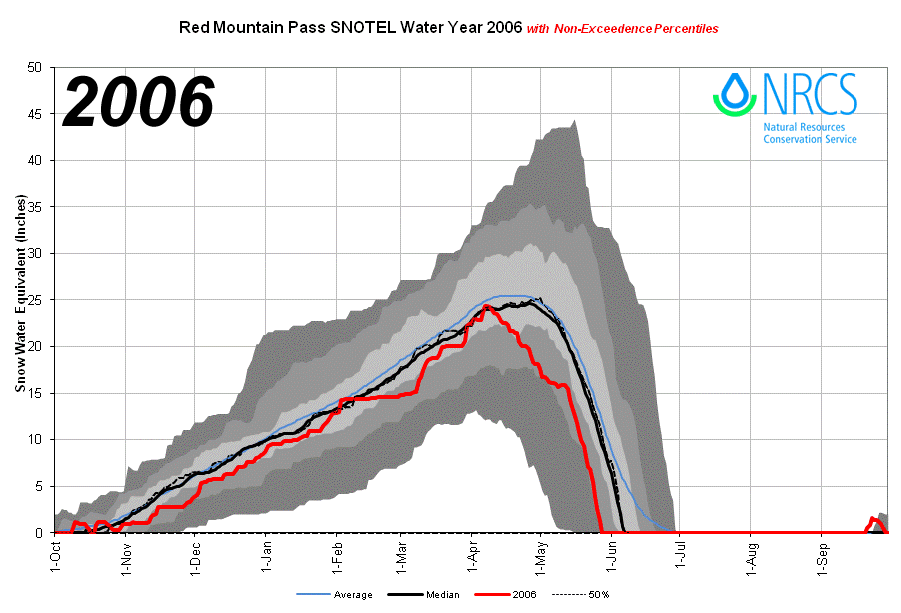
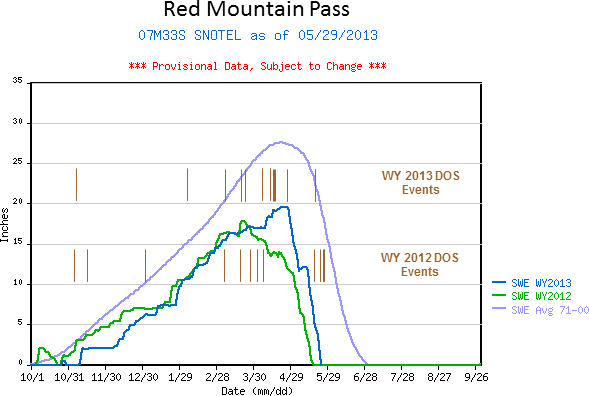
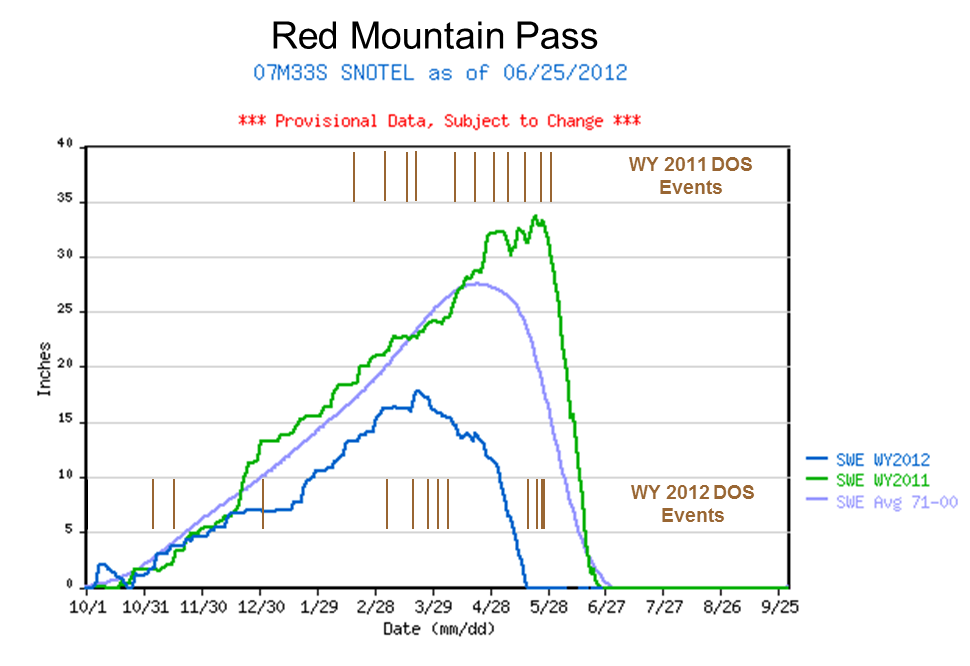
SWE Plots
for Senator Beck Basin at Red Mountain Pass
SWE Plots
for Senator Beck Basin at Red Mountain Pass
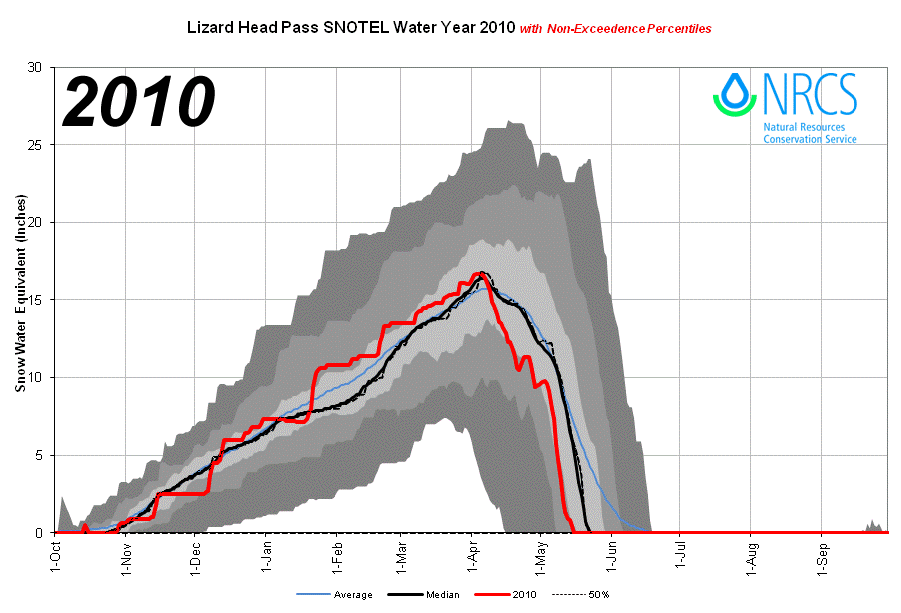
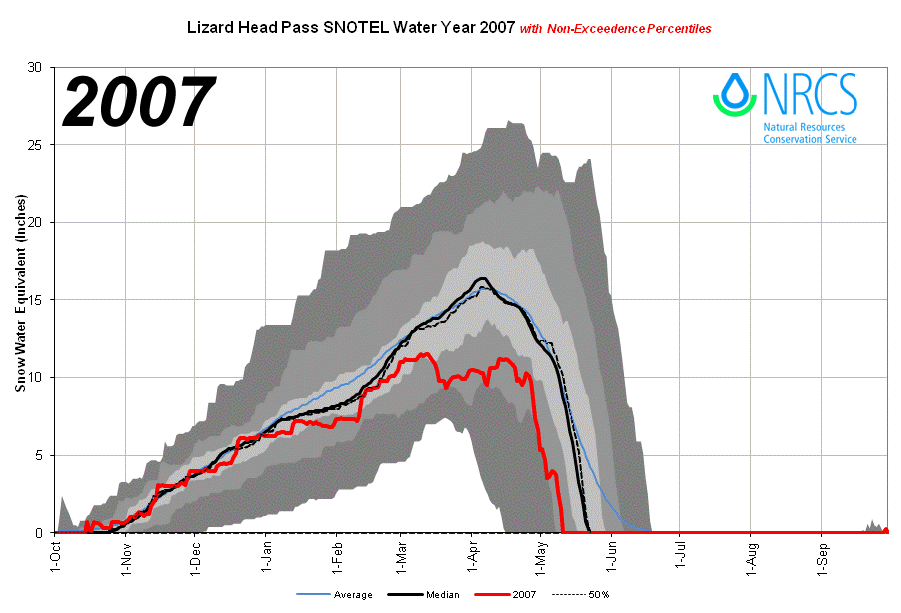
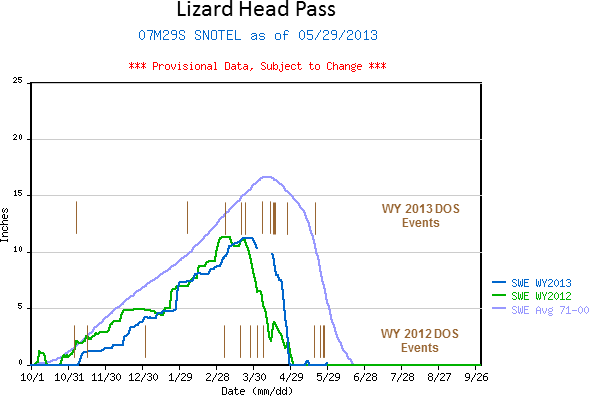
For each Snotel site below, the first nine plots show a single Water Year's SWE relative to the site's historical record (1971 - current). The last two plots compare SWE and Dust on Snow events for two consecutive years. The shaded bands represent non-exceedence percentiles in the following order (from the bottom up):
Minimum - 10th percentile (dark gray)
10th - 30th percentiles (medium gray)
30th - 70th percentiles (light gray) with 50% trace in the middle
70th - 90th percentiles (medium gray)
90th - maximum (dark gray)
For a more detailed explanation, see http://www.wrcc.dri.edu/spi/explanation.html


Snowmelt Rates
for Senator Beck Basin at Red Mountain Pass
Snowmelt Rates
for Senator Beck Basin at Red Mountain Pass
[1] Adding column F to column C and dividing by column D, to account for extra snow deposited after peak SWE.
[1] Adding column F to column C and dividing by column D, to account for extra snow deposited after peak SWE.
Analyses of Red Mountain Pass and Lizard Head Pass Snotel data for Water Years 2006-2017 snowmelt seasons showing date and quantity of peak SWE, days from peak SWE to “snow all gone” (SAG), total additional precipitation after the date of peak SWE, an “adjusted” mean daily rate of snowmelt adding the additional precipitation to the peak SWE total, the maximum five-day moving average of daily melt, and the mean air temperature over the entire snowmelt period, from peak SWE to SAG. POR refers to each snotel's entire period of record.
Our Snowmelt Excel Workbooks for Red Mountain Pass and Lizard Head Pass snotels contain spreadsheets for each year, including a summary aggregating all years. See our Snotel Dataset page for downloadable Excel files for each CODOS site, and an "All CODOS Sites Aggregated" Excel workbook containing spreadsheets for Water Years 2006-2017 and a summary of all years combined.
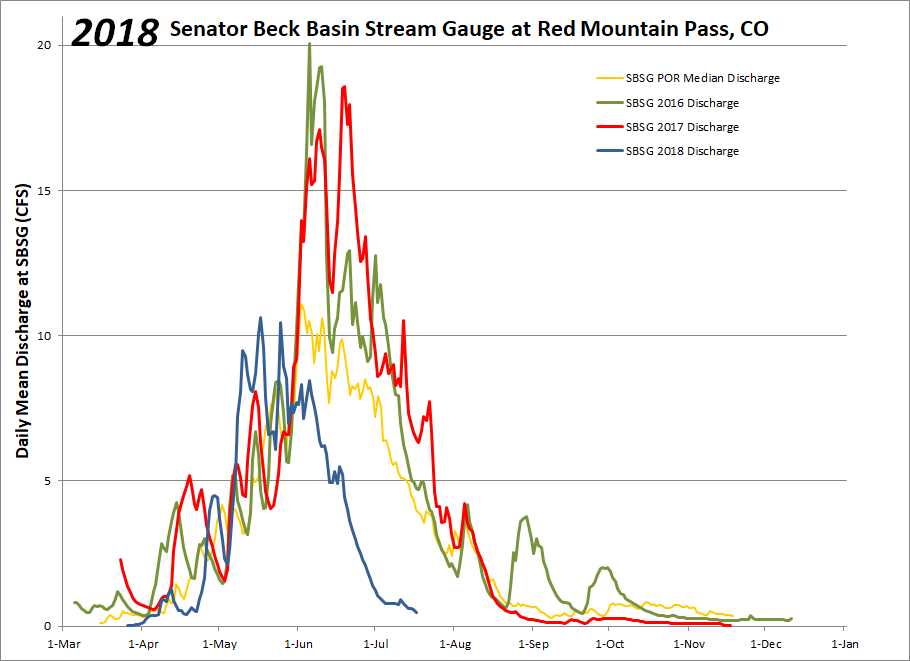
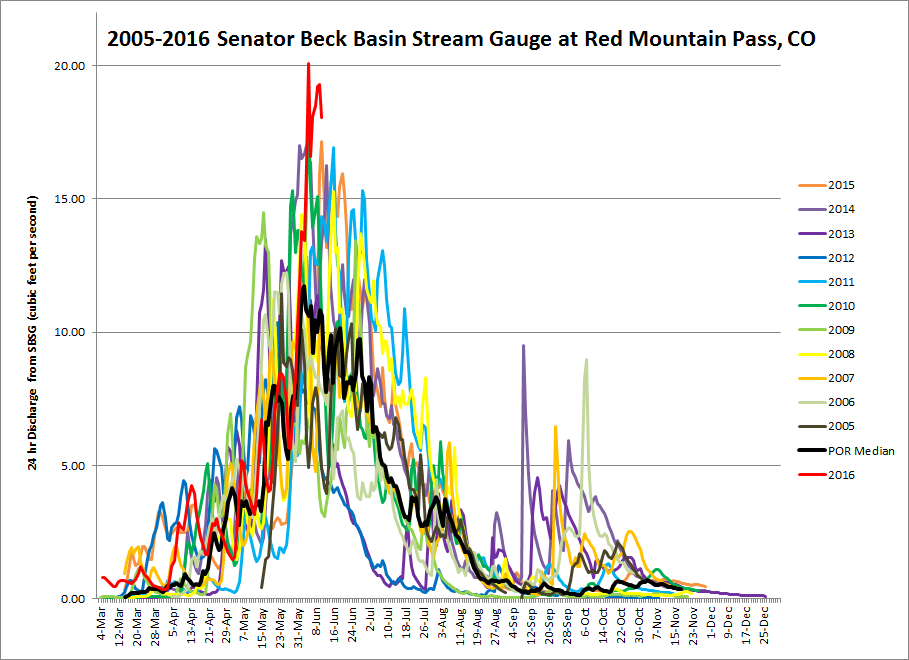
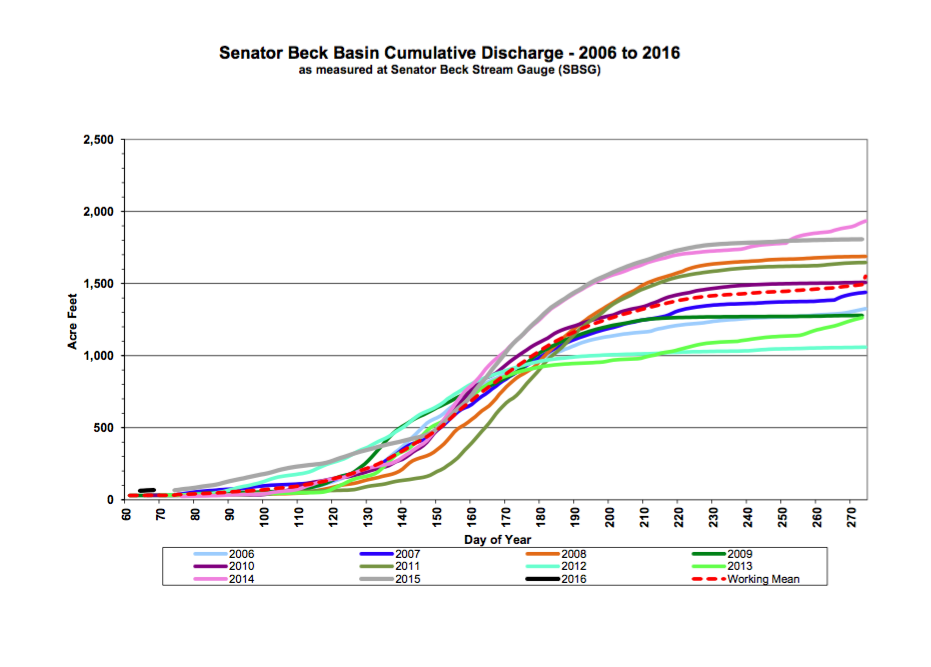
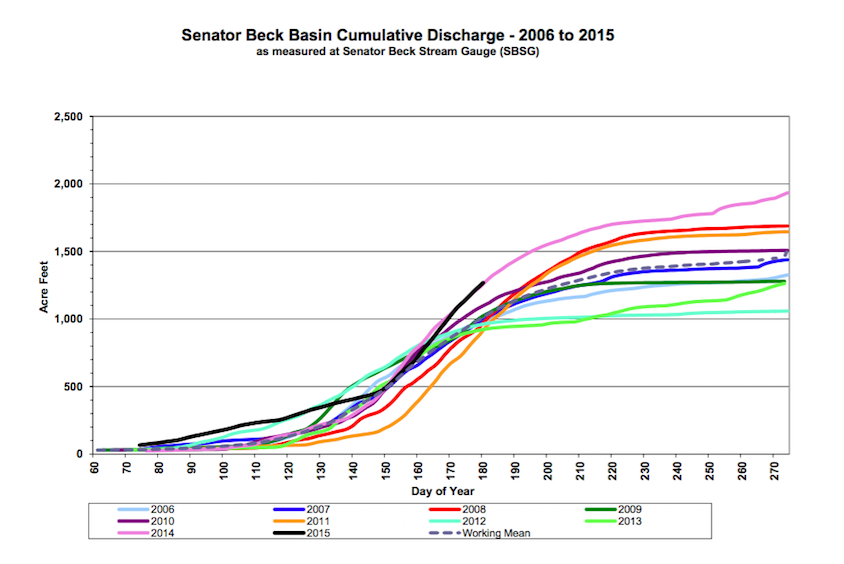
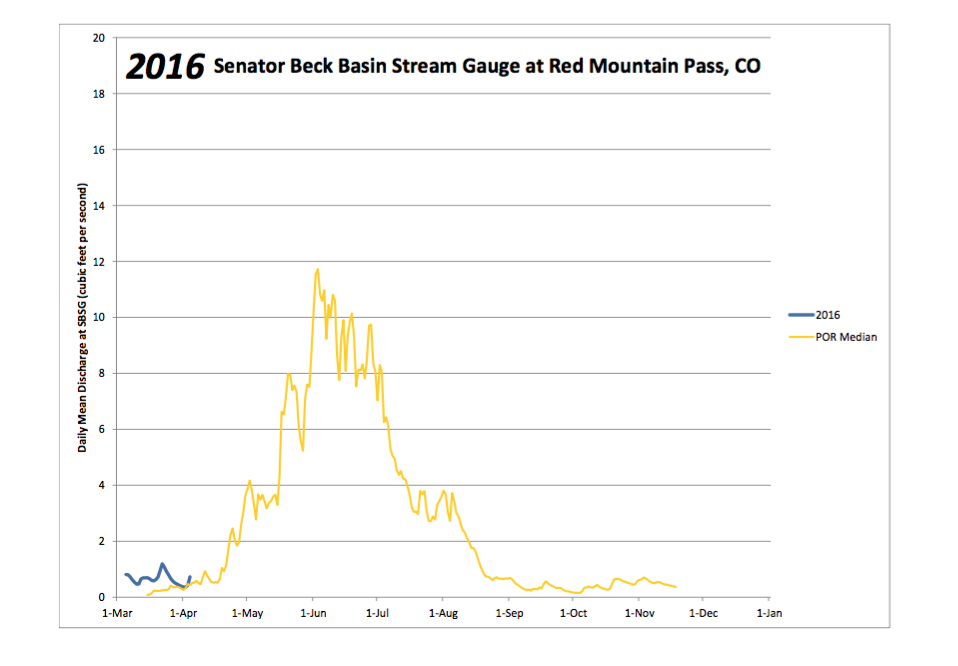
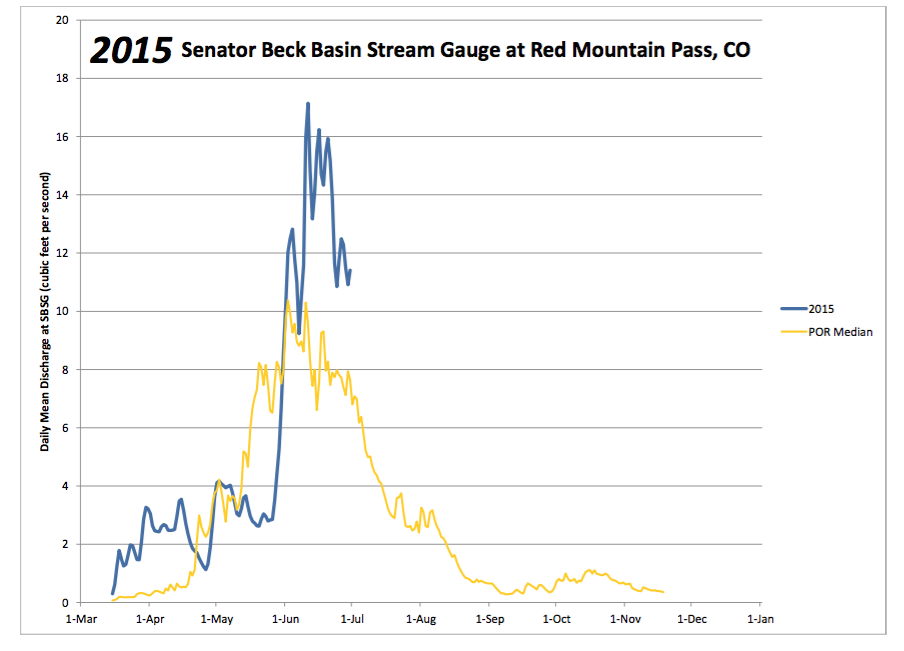
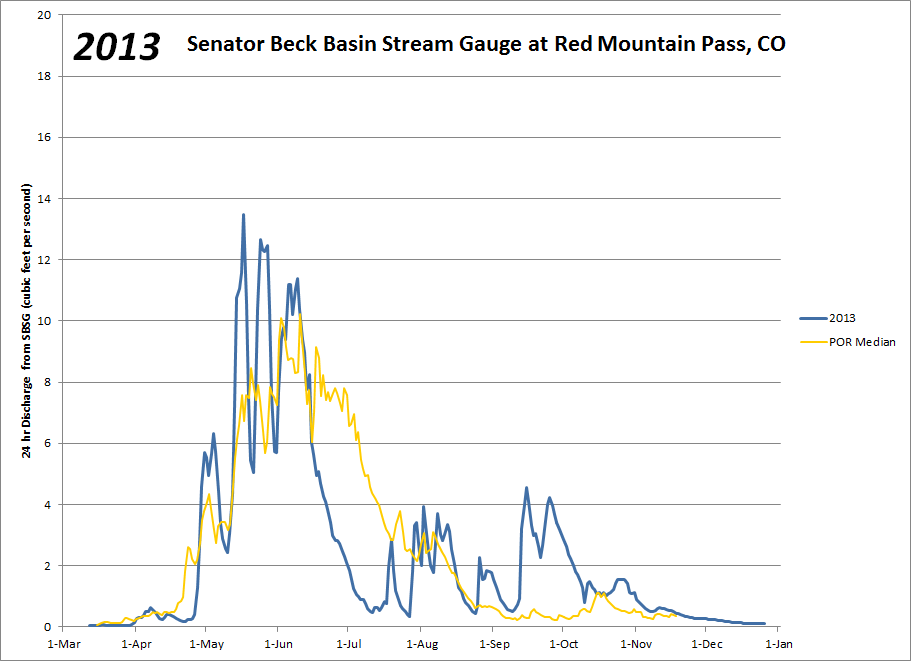
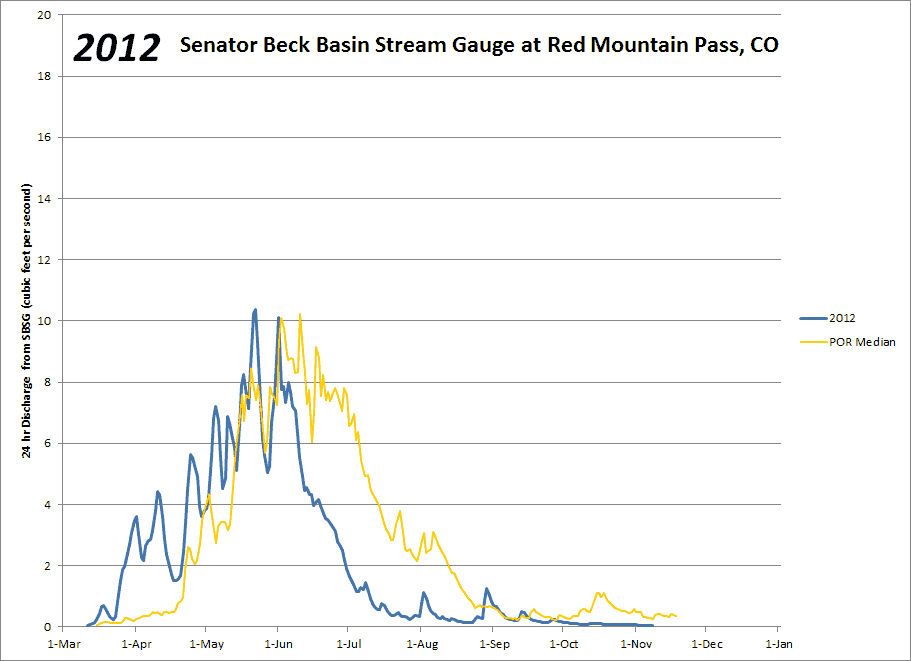
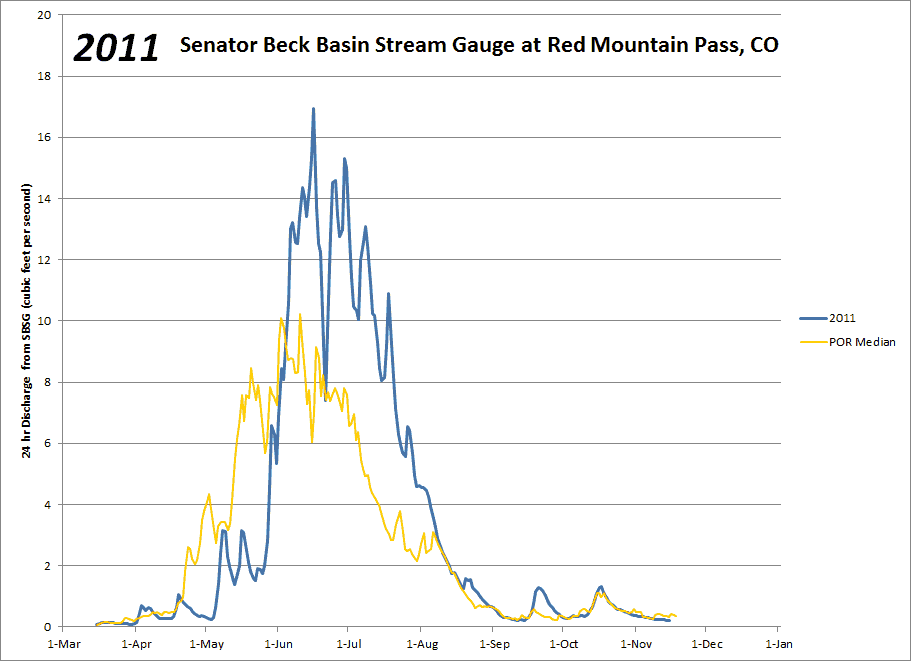
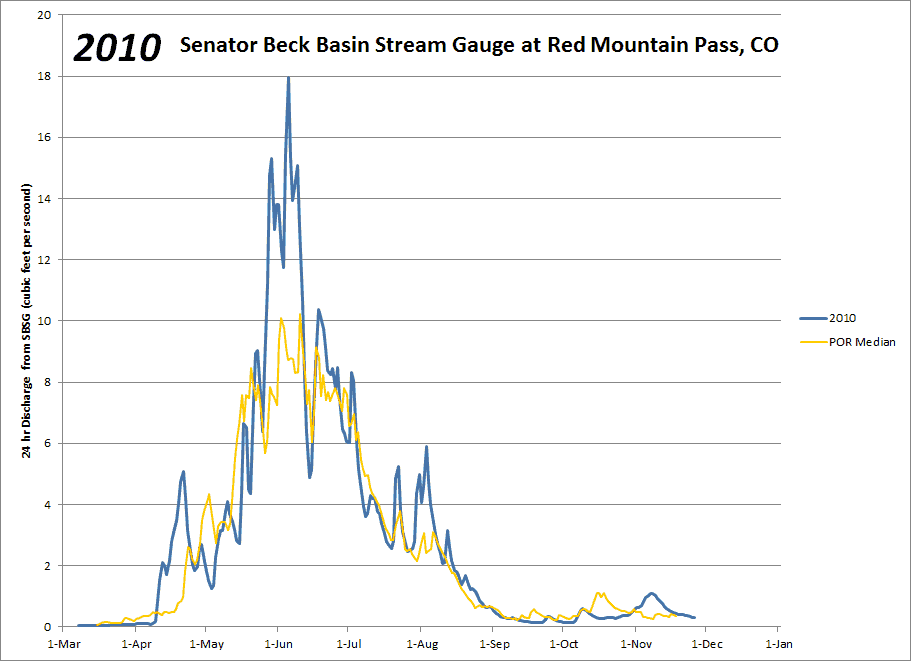
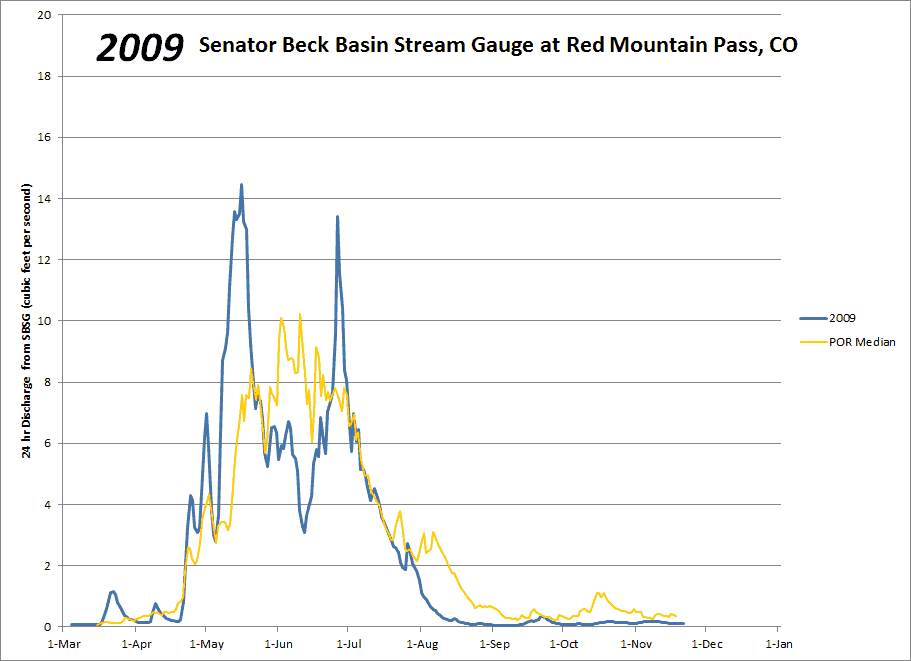
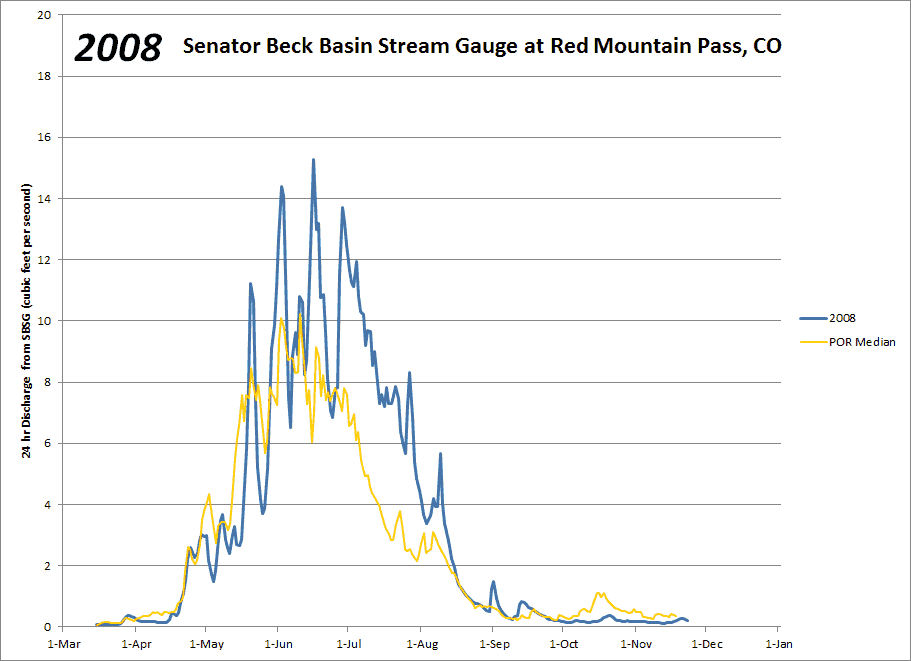
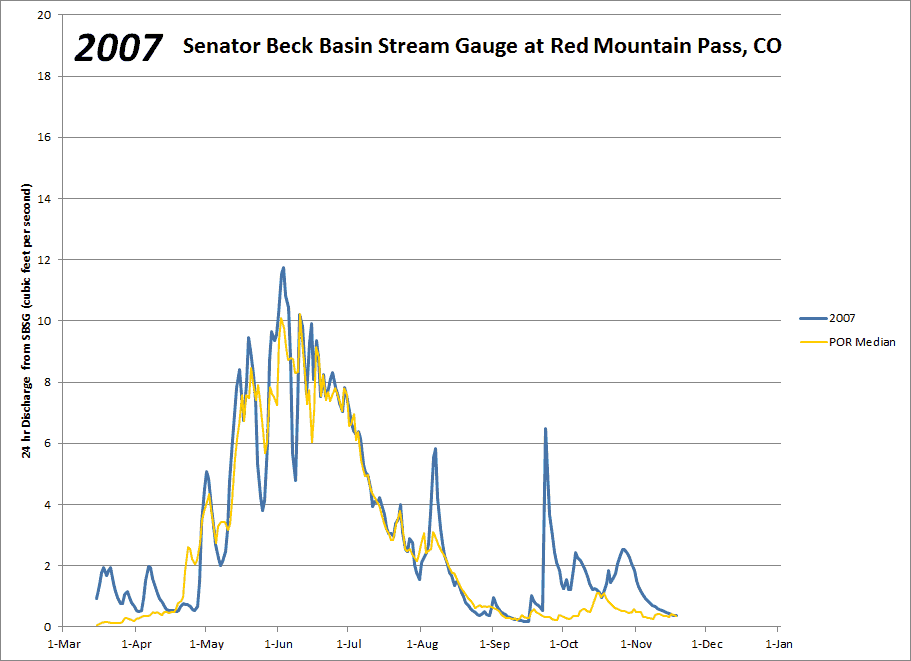
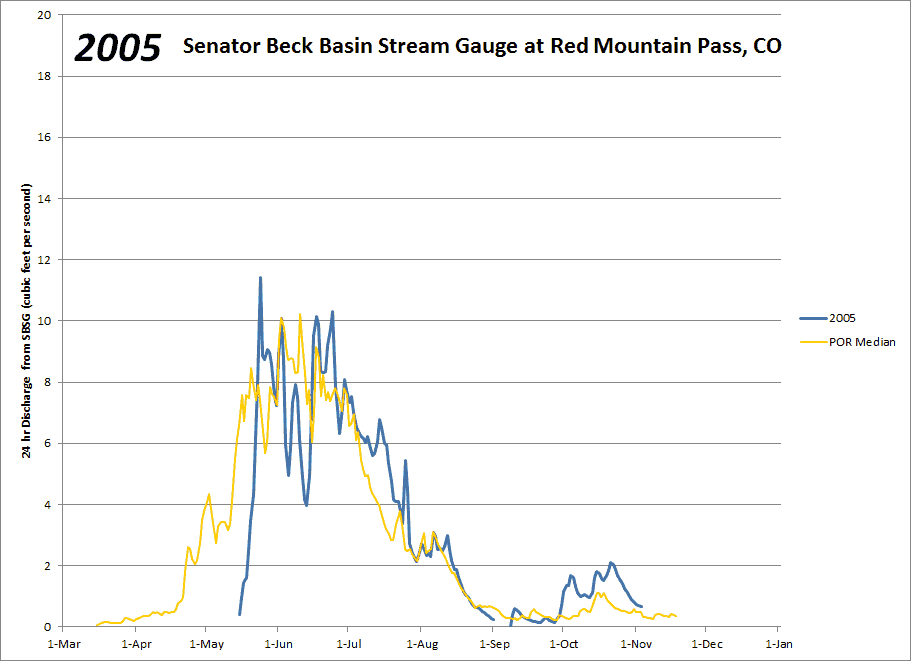
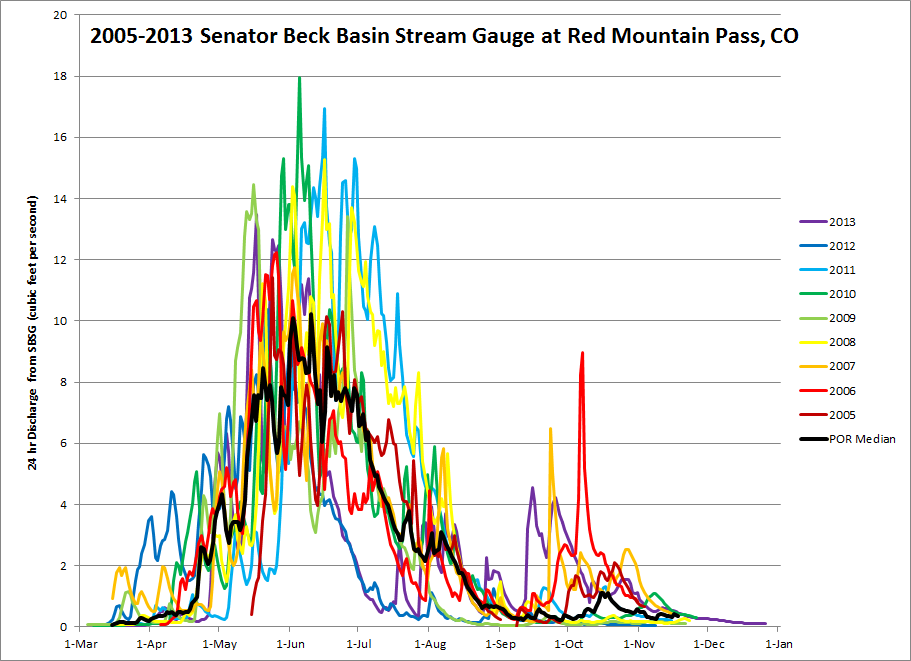
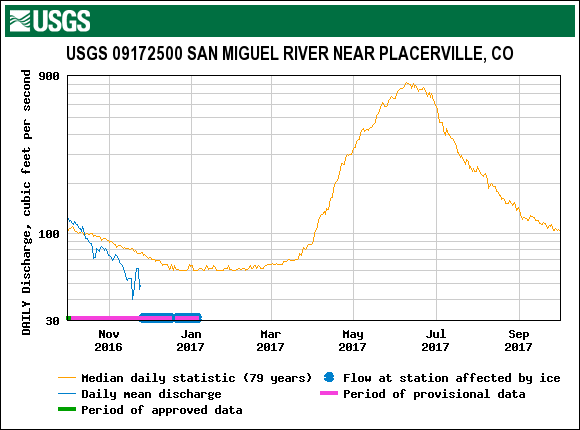
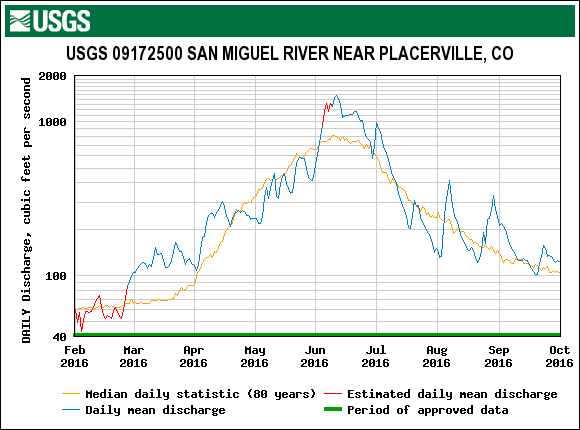
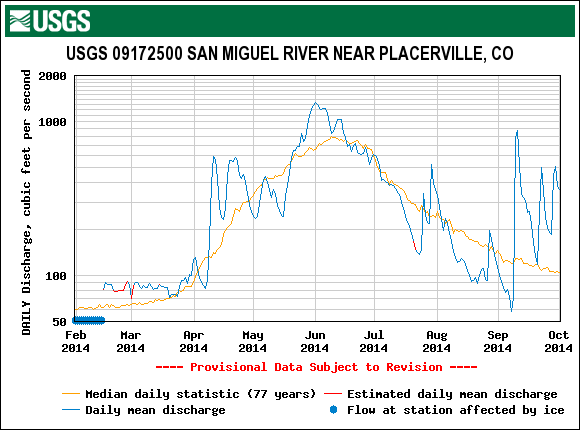
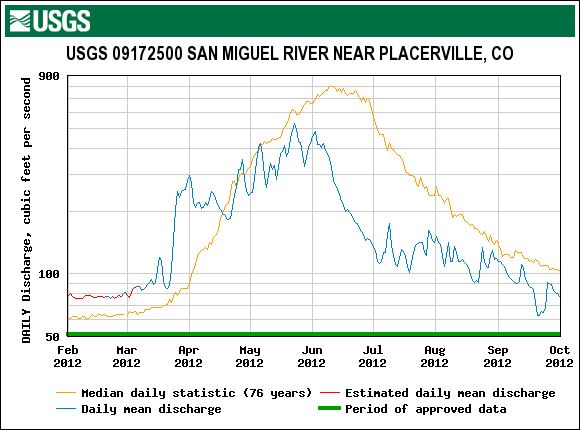
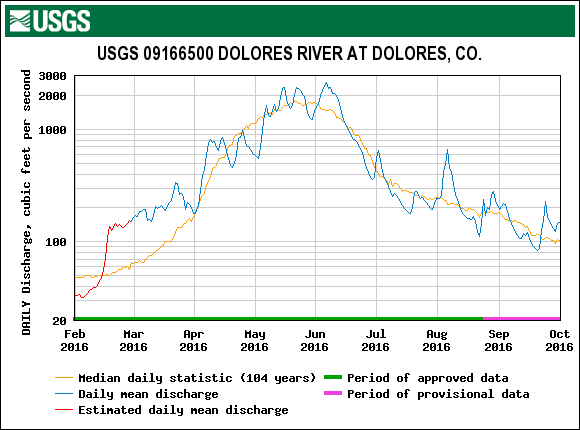
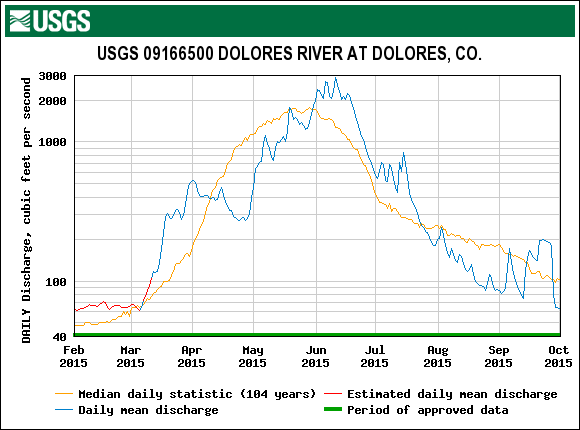
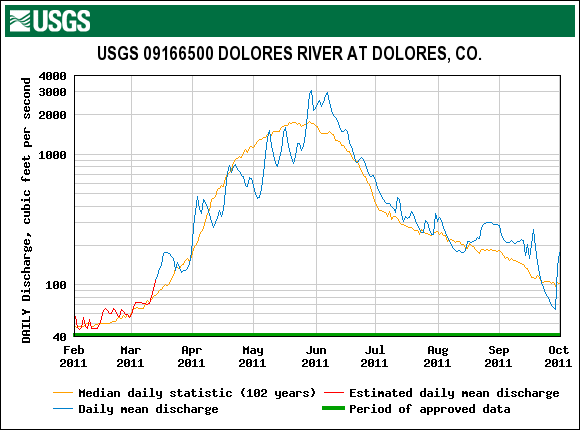
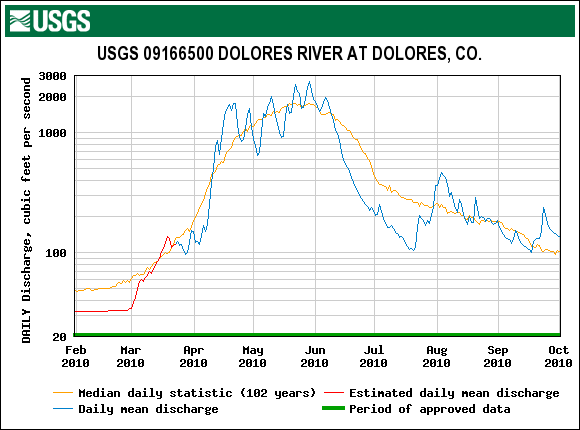
Hydrographs
for Senator Beck Basin at Red Mountain Pass
Hydrographs
for Senator Beck Basin at Red Mountain Pass


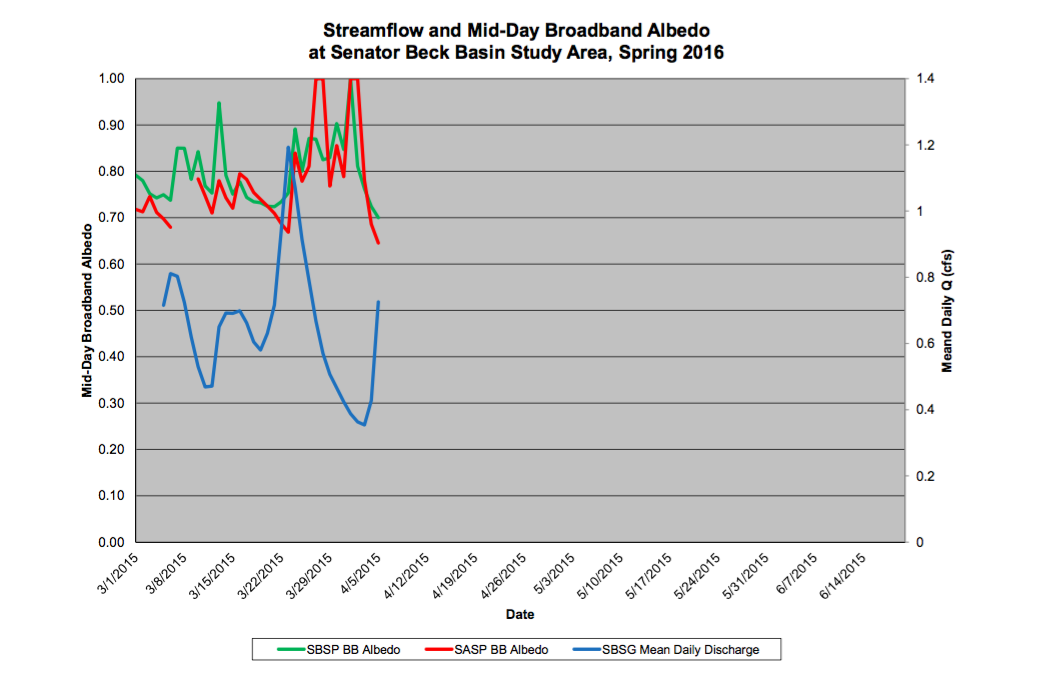
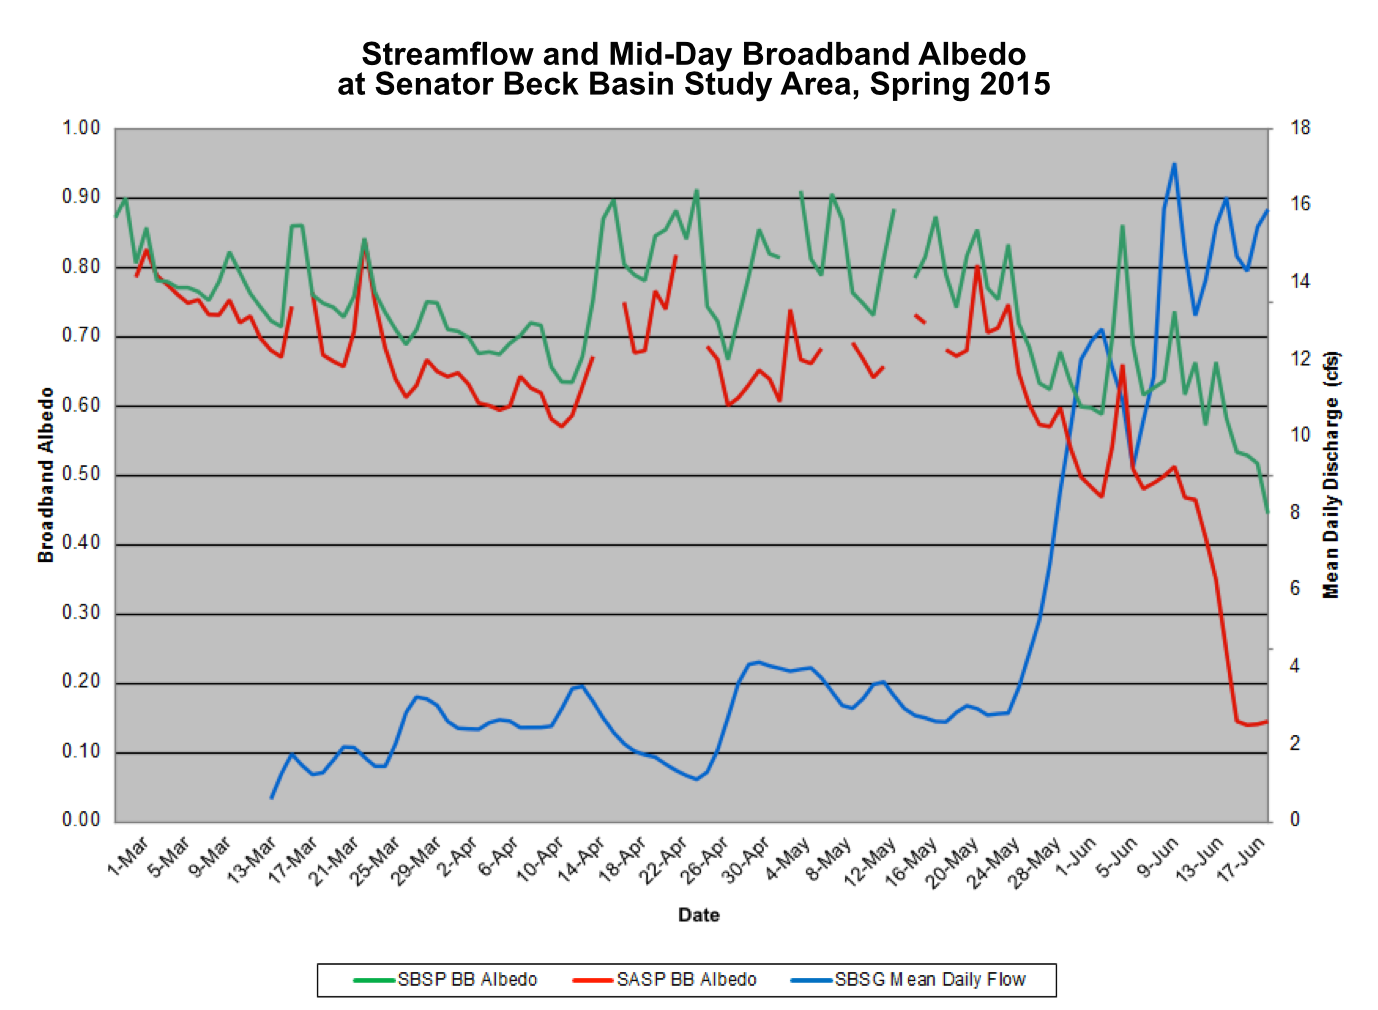
![Albedo_and_Flow_2014[1].png](https://images.squarespace-cdn.com/content/v1/52a10a08e4b05a96c777d05a/1406159023907-63HW8O13MKJUTZV12O4P/Albedo_and_Flow_2014%5B1%5D.png)
![albedo-streamflow-graph[1].png](https://images.squarespace-cdn.com/content/v1/52a10a08e4b05a96c777d05a/1406159068546-0J8AACYATRNUREK3QEUB/albedo-streamflow-graph%5B1%5D.png)
![albedo-streamflow-graph_2012[1].png](https://images.squarespace-cdn.com/content/v1/52a10a08e4b05a96c777d05a/1406159118620-Y4FVLRKDR04NLEBTL5D4/albedo-streamflow-graph_2012%5B1%5D.png)
Above: Spring snowpack albedo at the Senator Beck Study Area plotted over Senator Beck Basin snowmelt discharge.


Snow Profiles
for Senator Beck Basin
Swamp Angel Study Plot (SASP) &
Senator Beck Study Plot (SBSP)
Snow Profiles
for Senator Beck Basin
Swamp Angel Study Plot (SASP) &
Senator Beck Study Plot (SBSP)
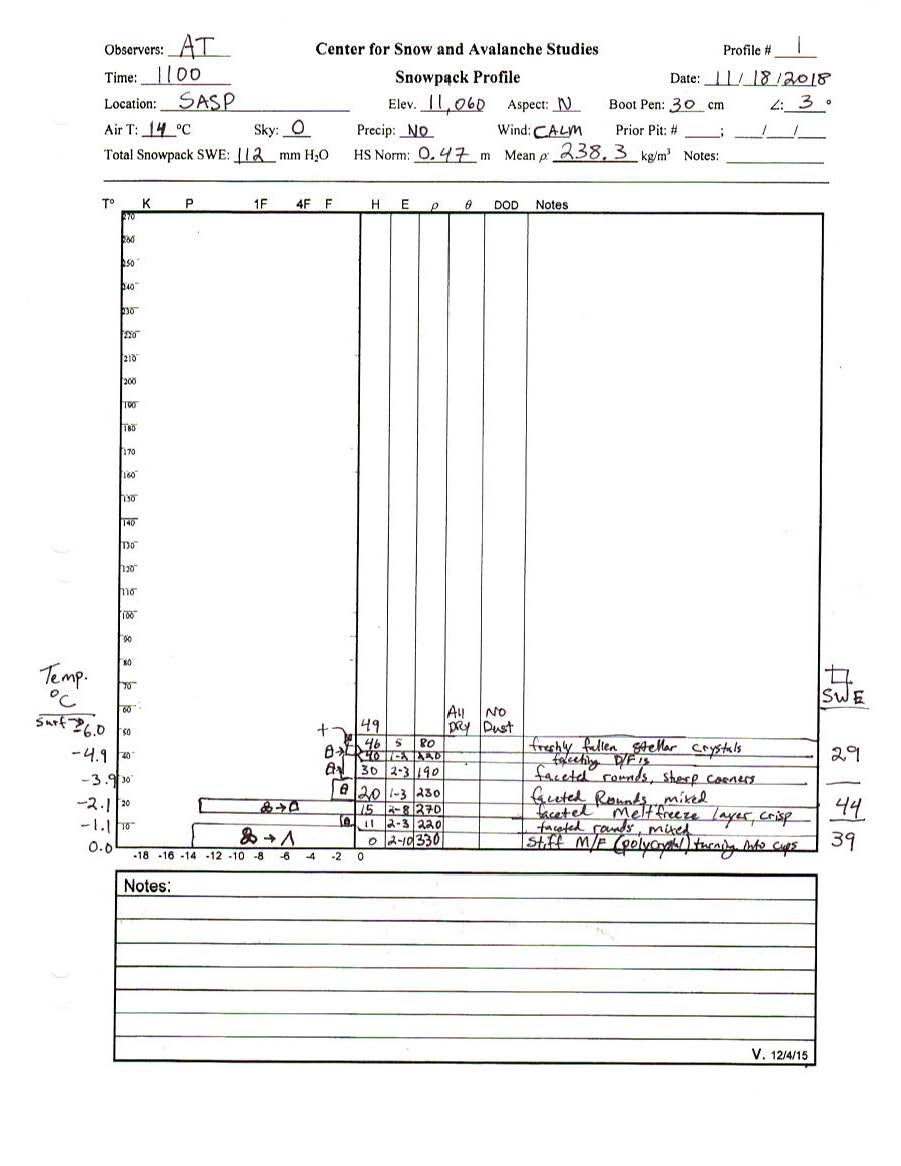
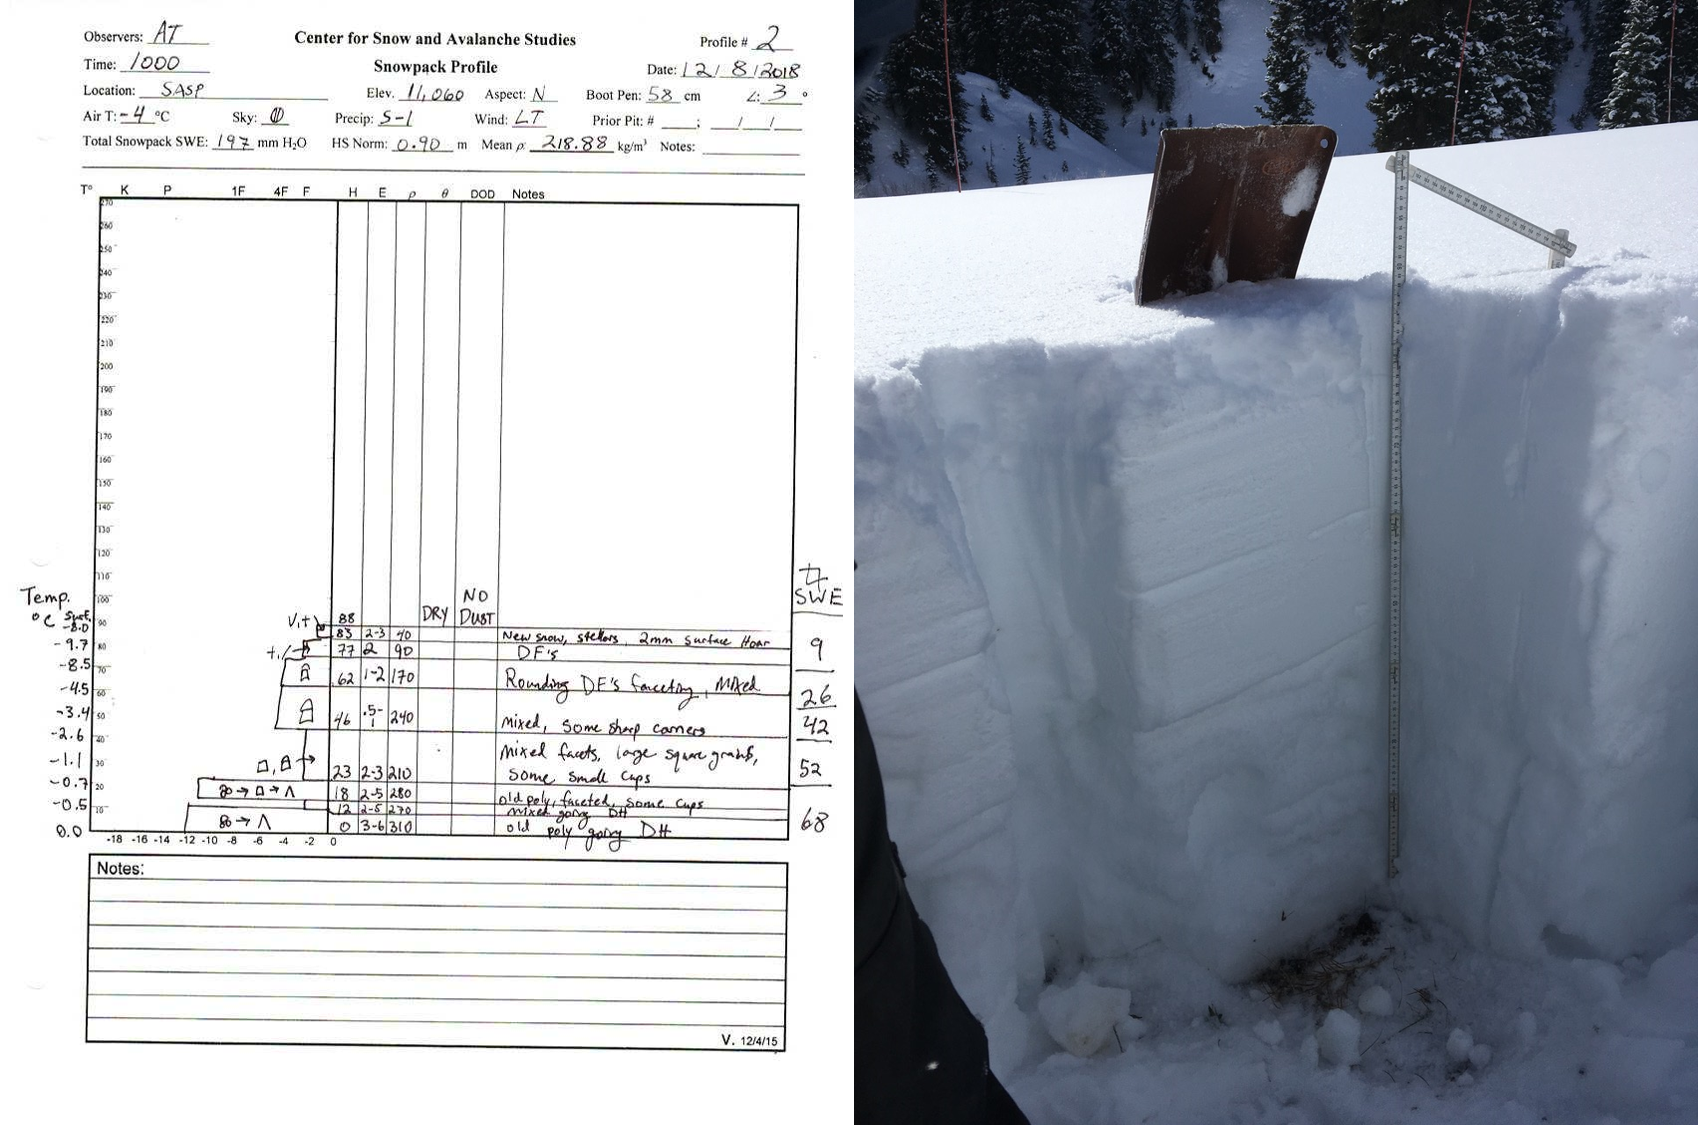
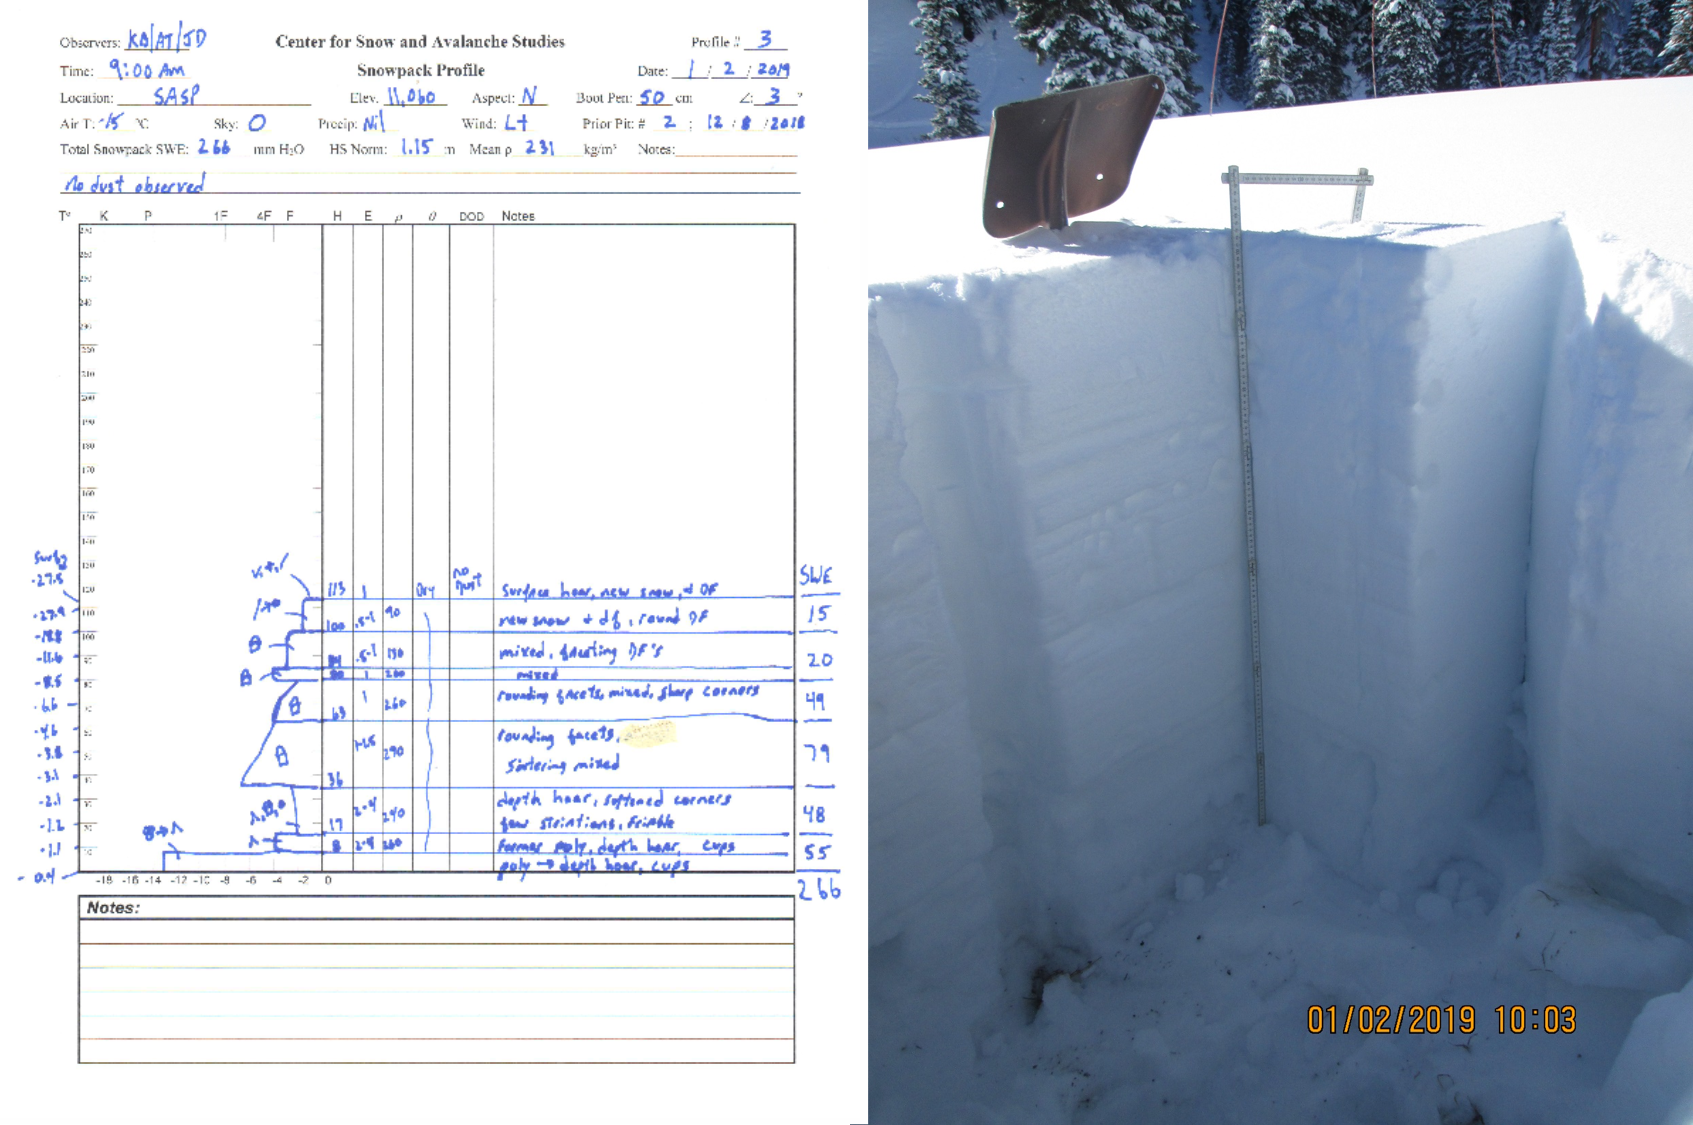
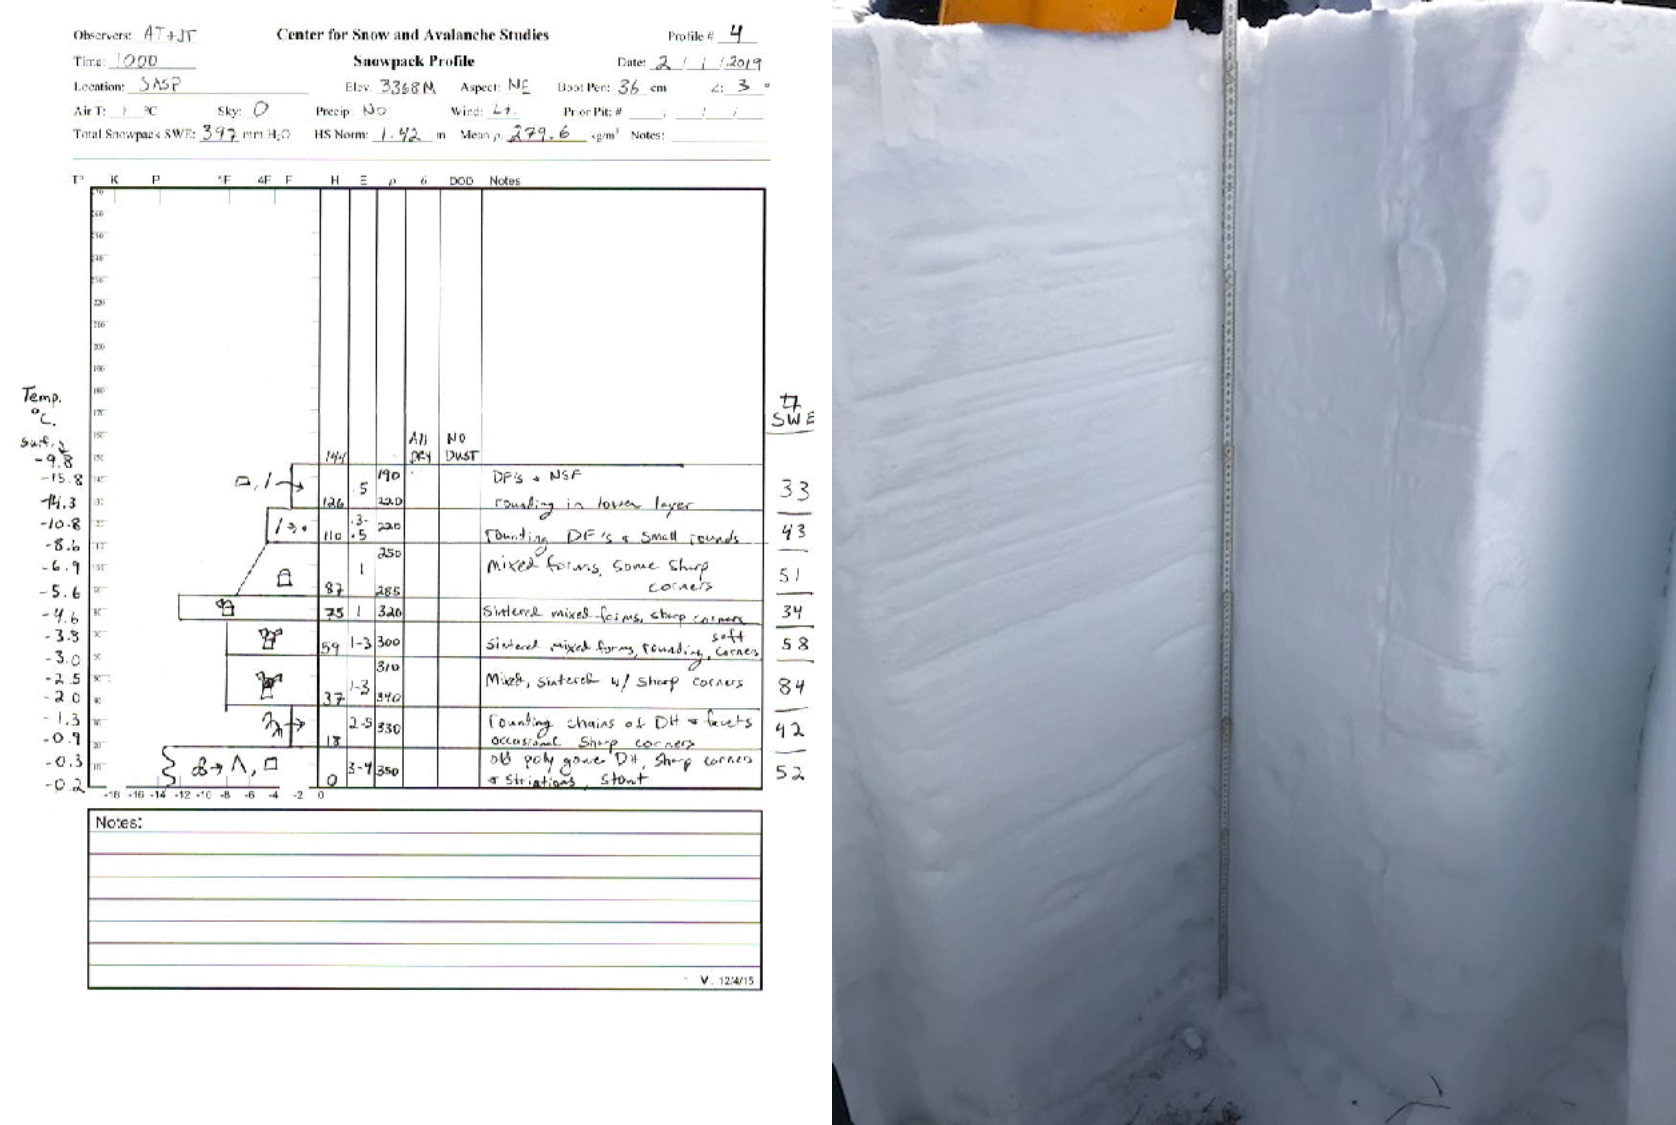
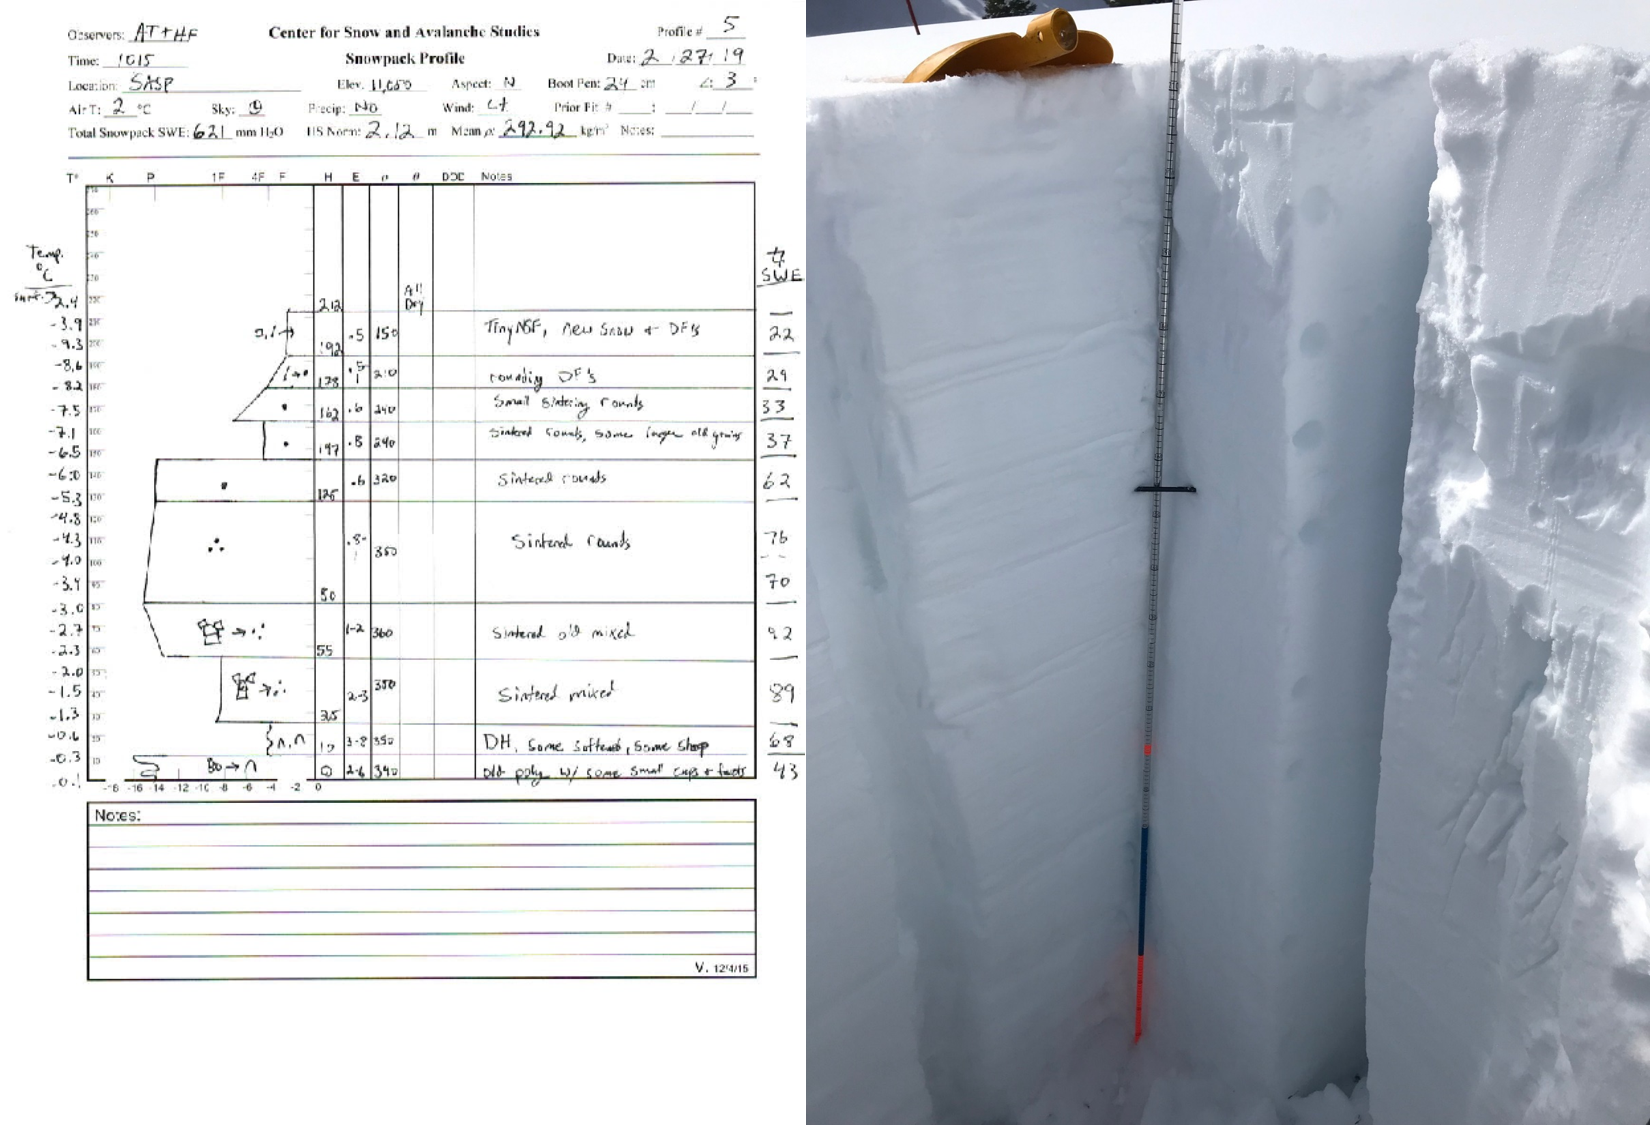
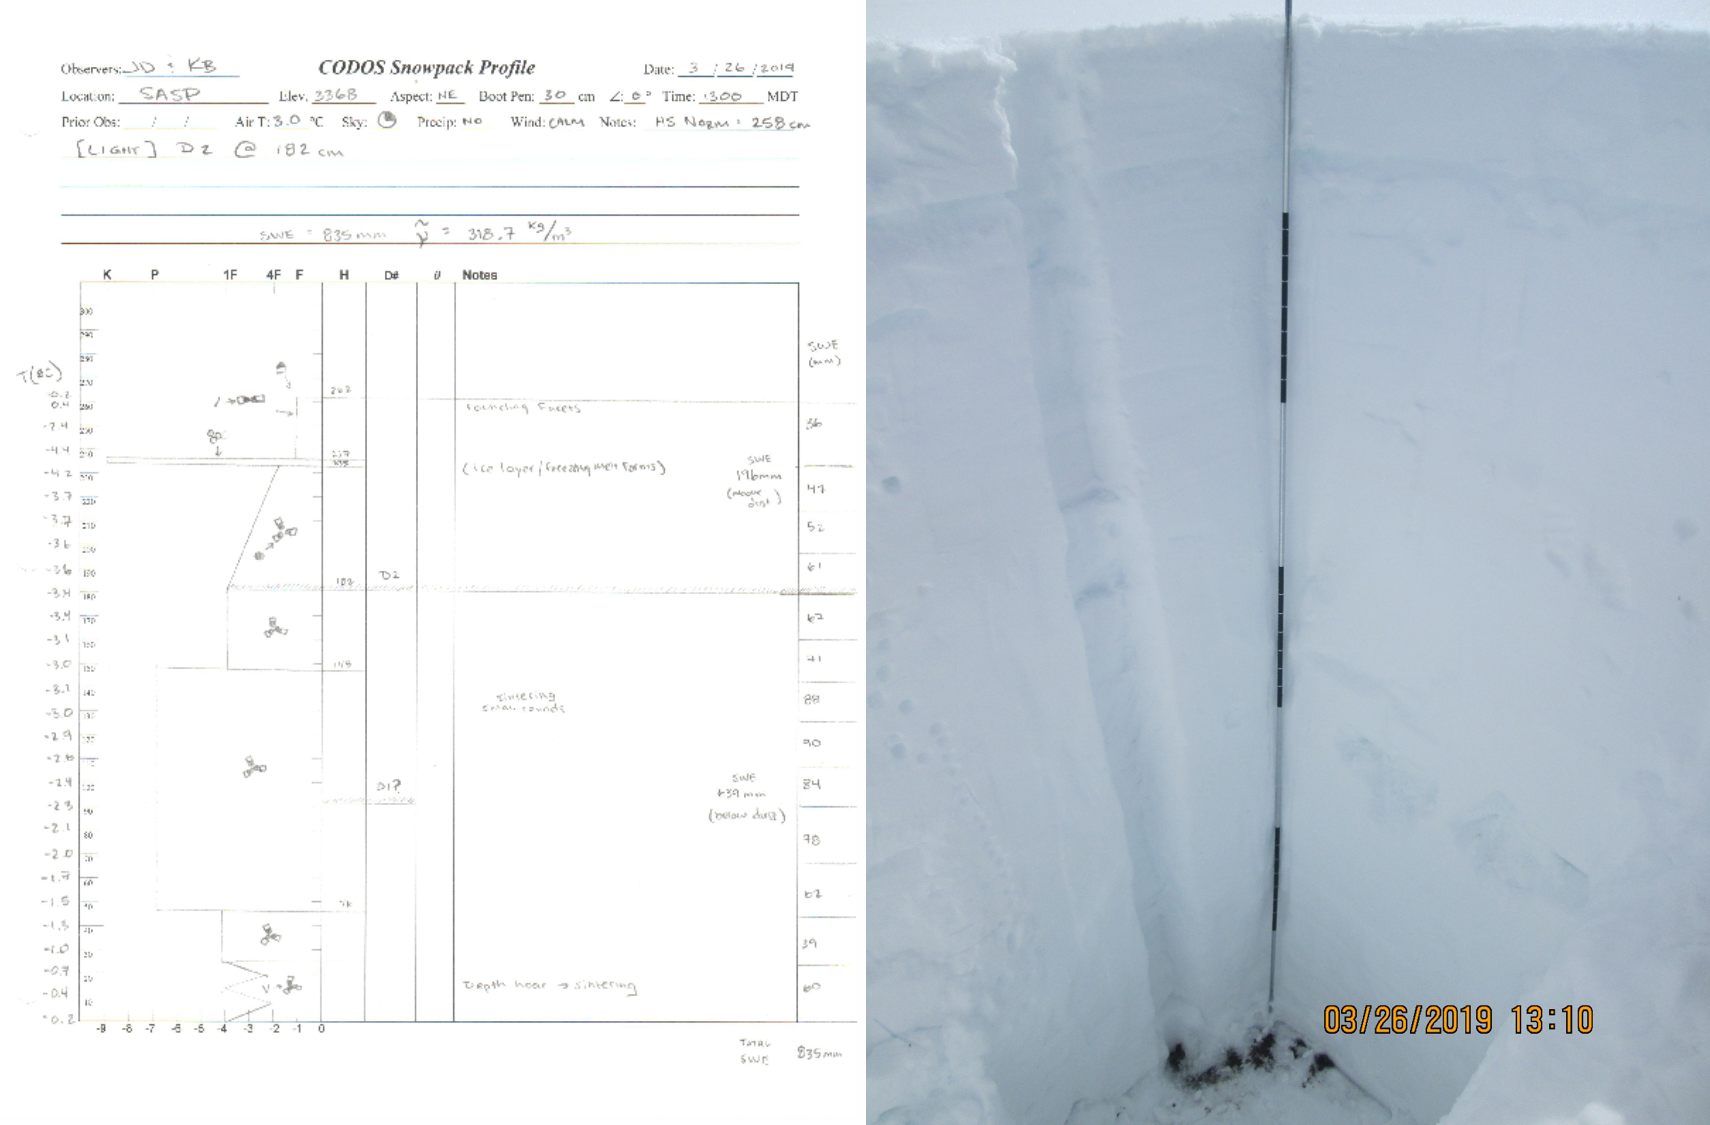
PDFs of snow profiles:
WY 2022
WY 2023
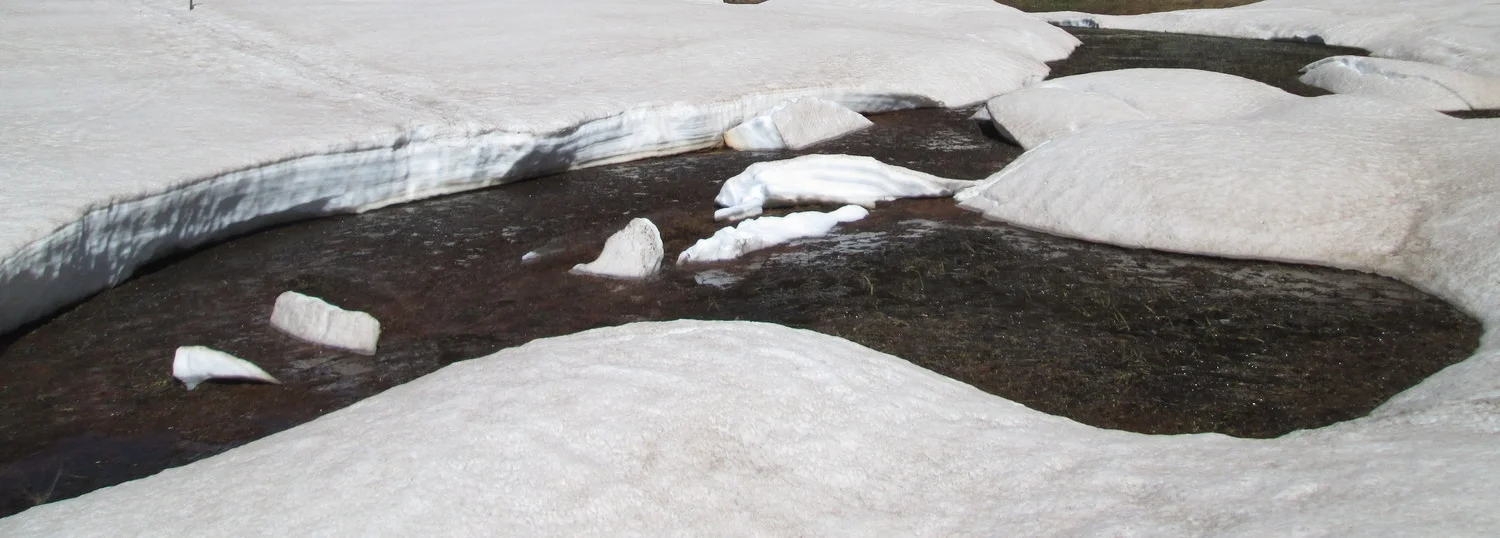
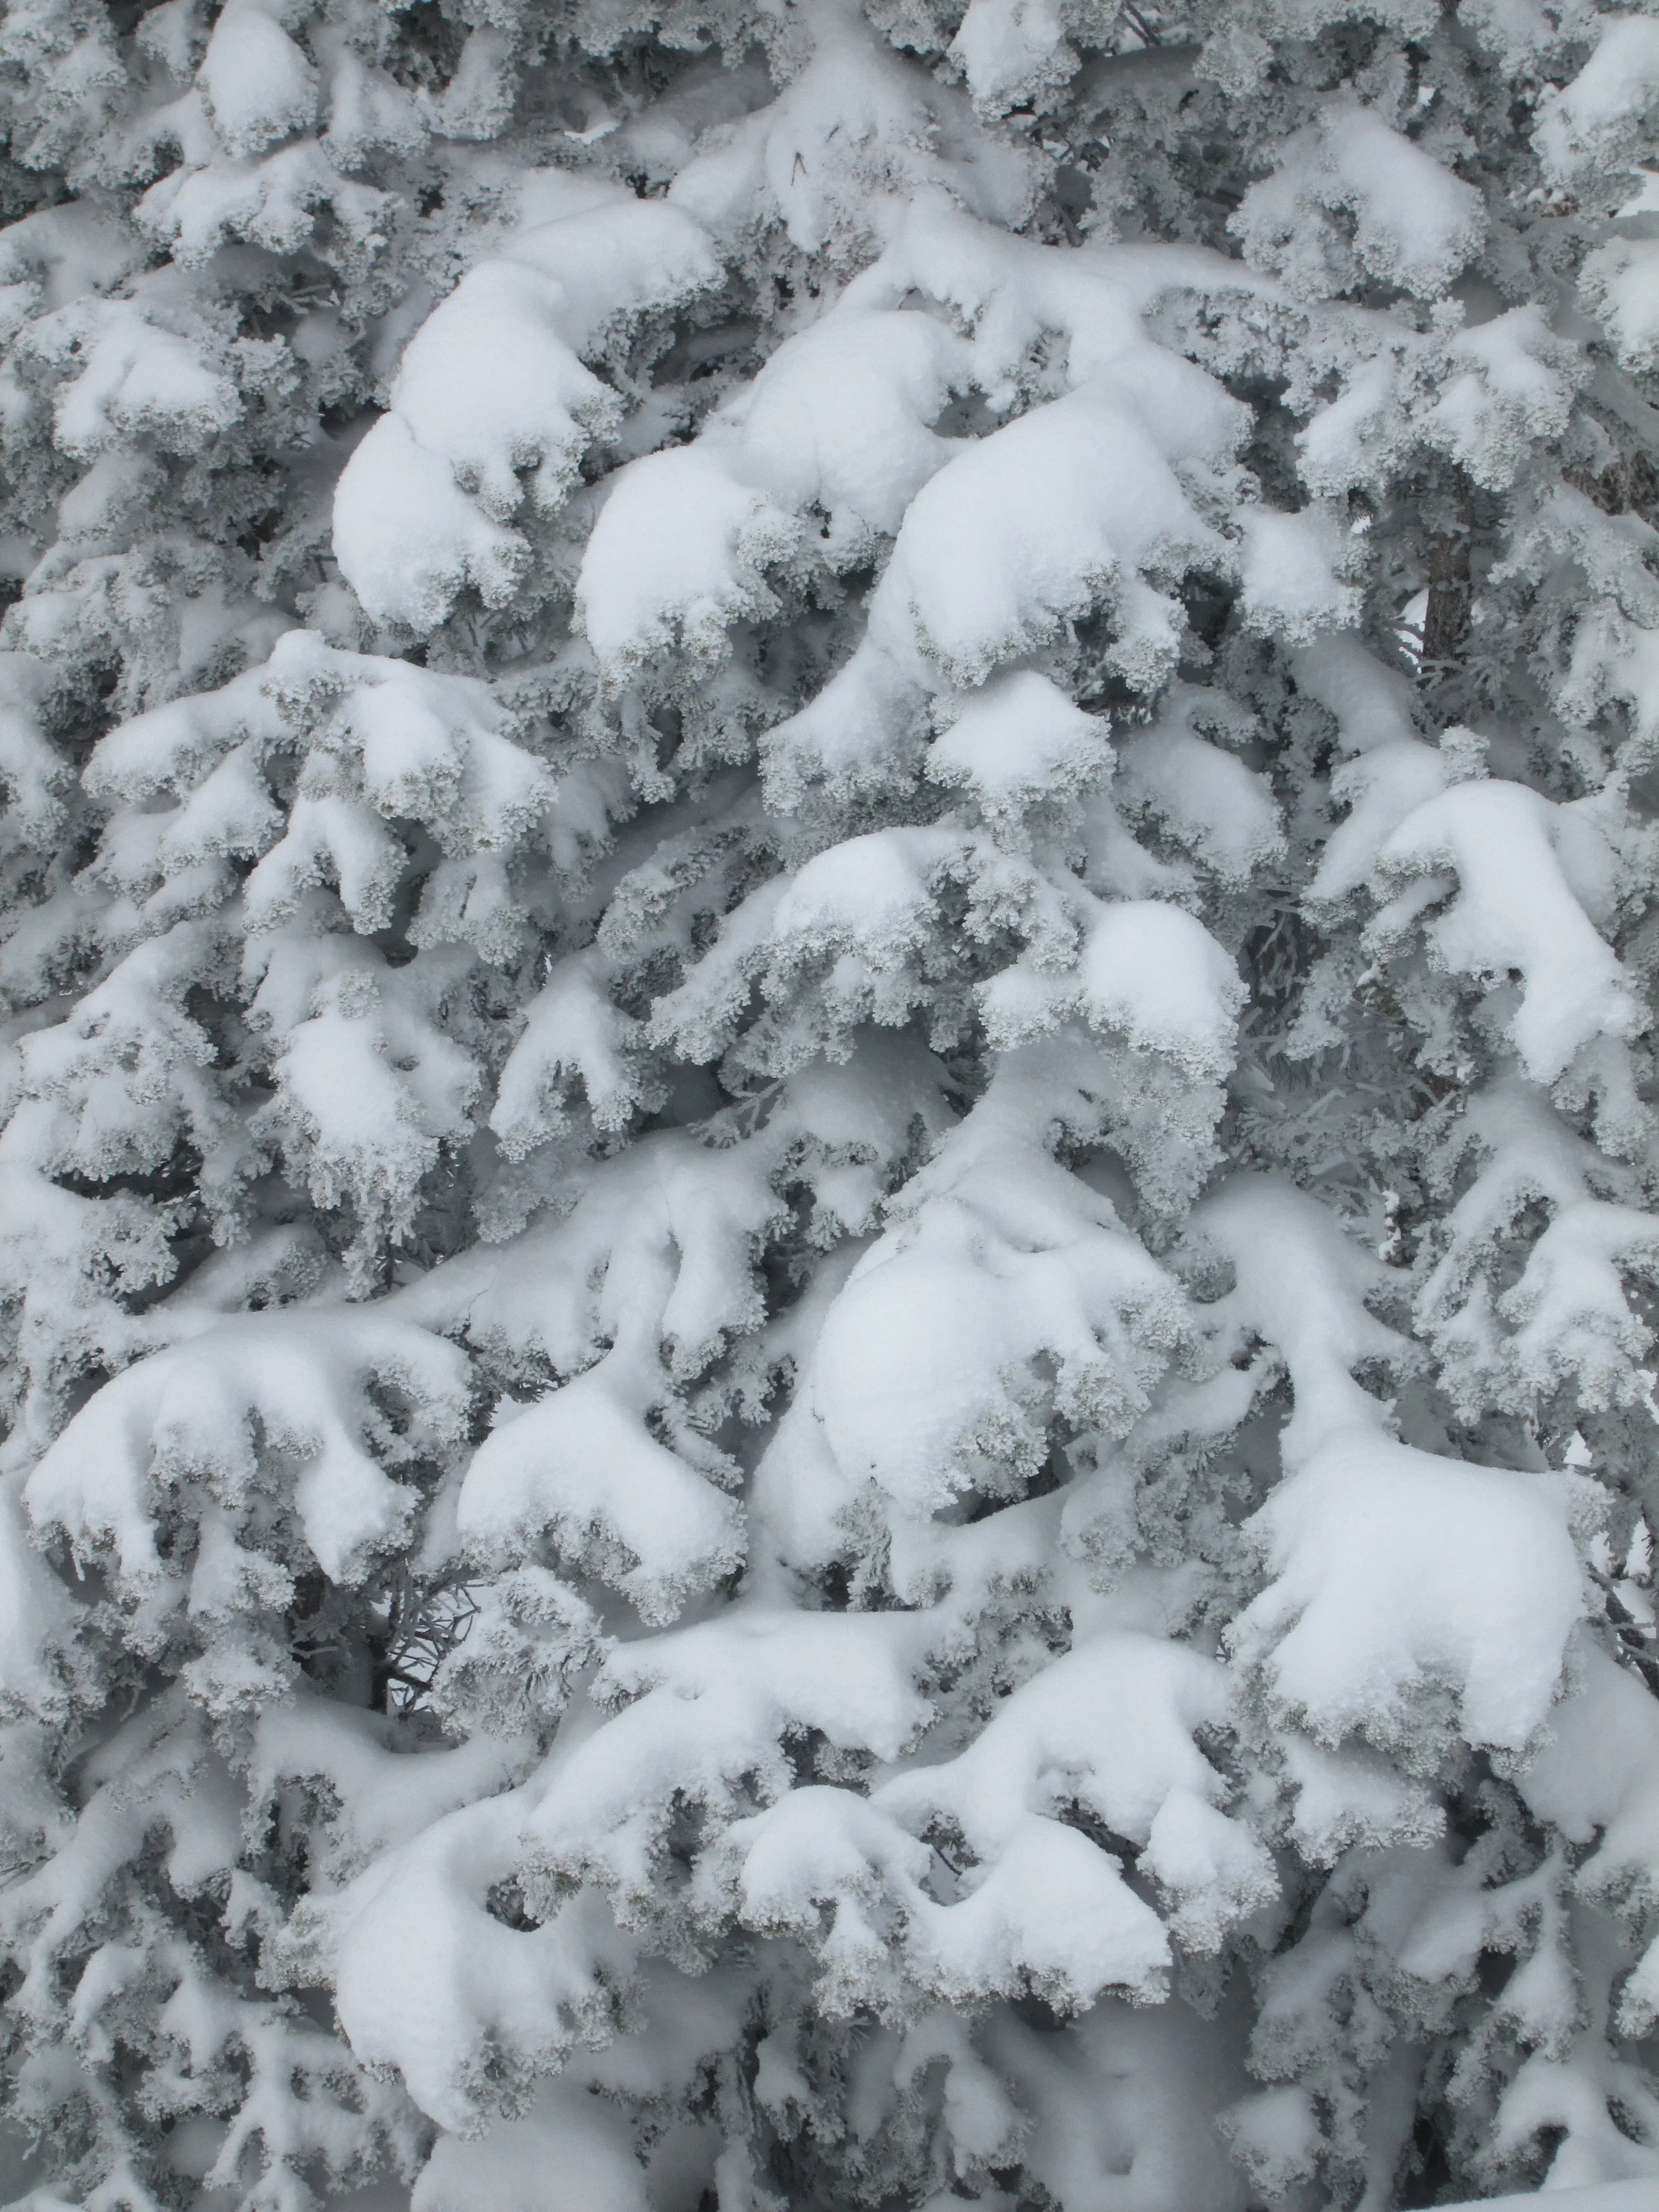
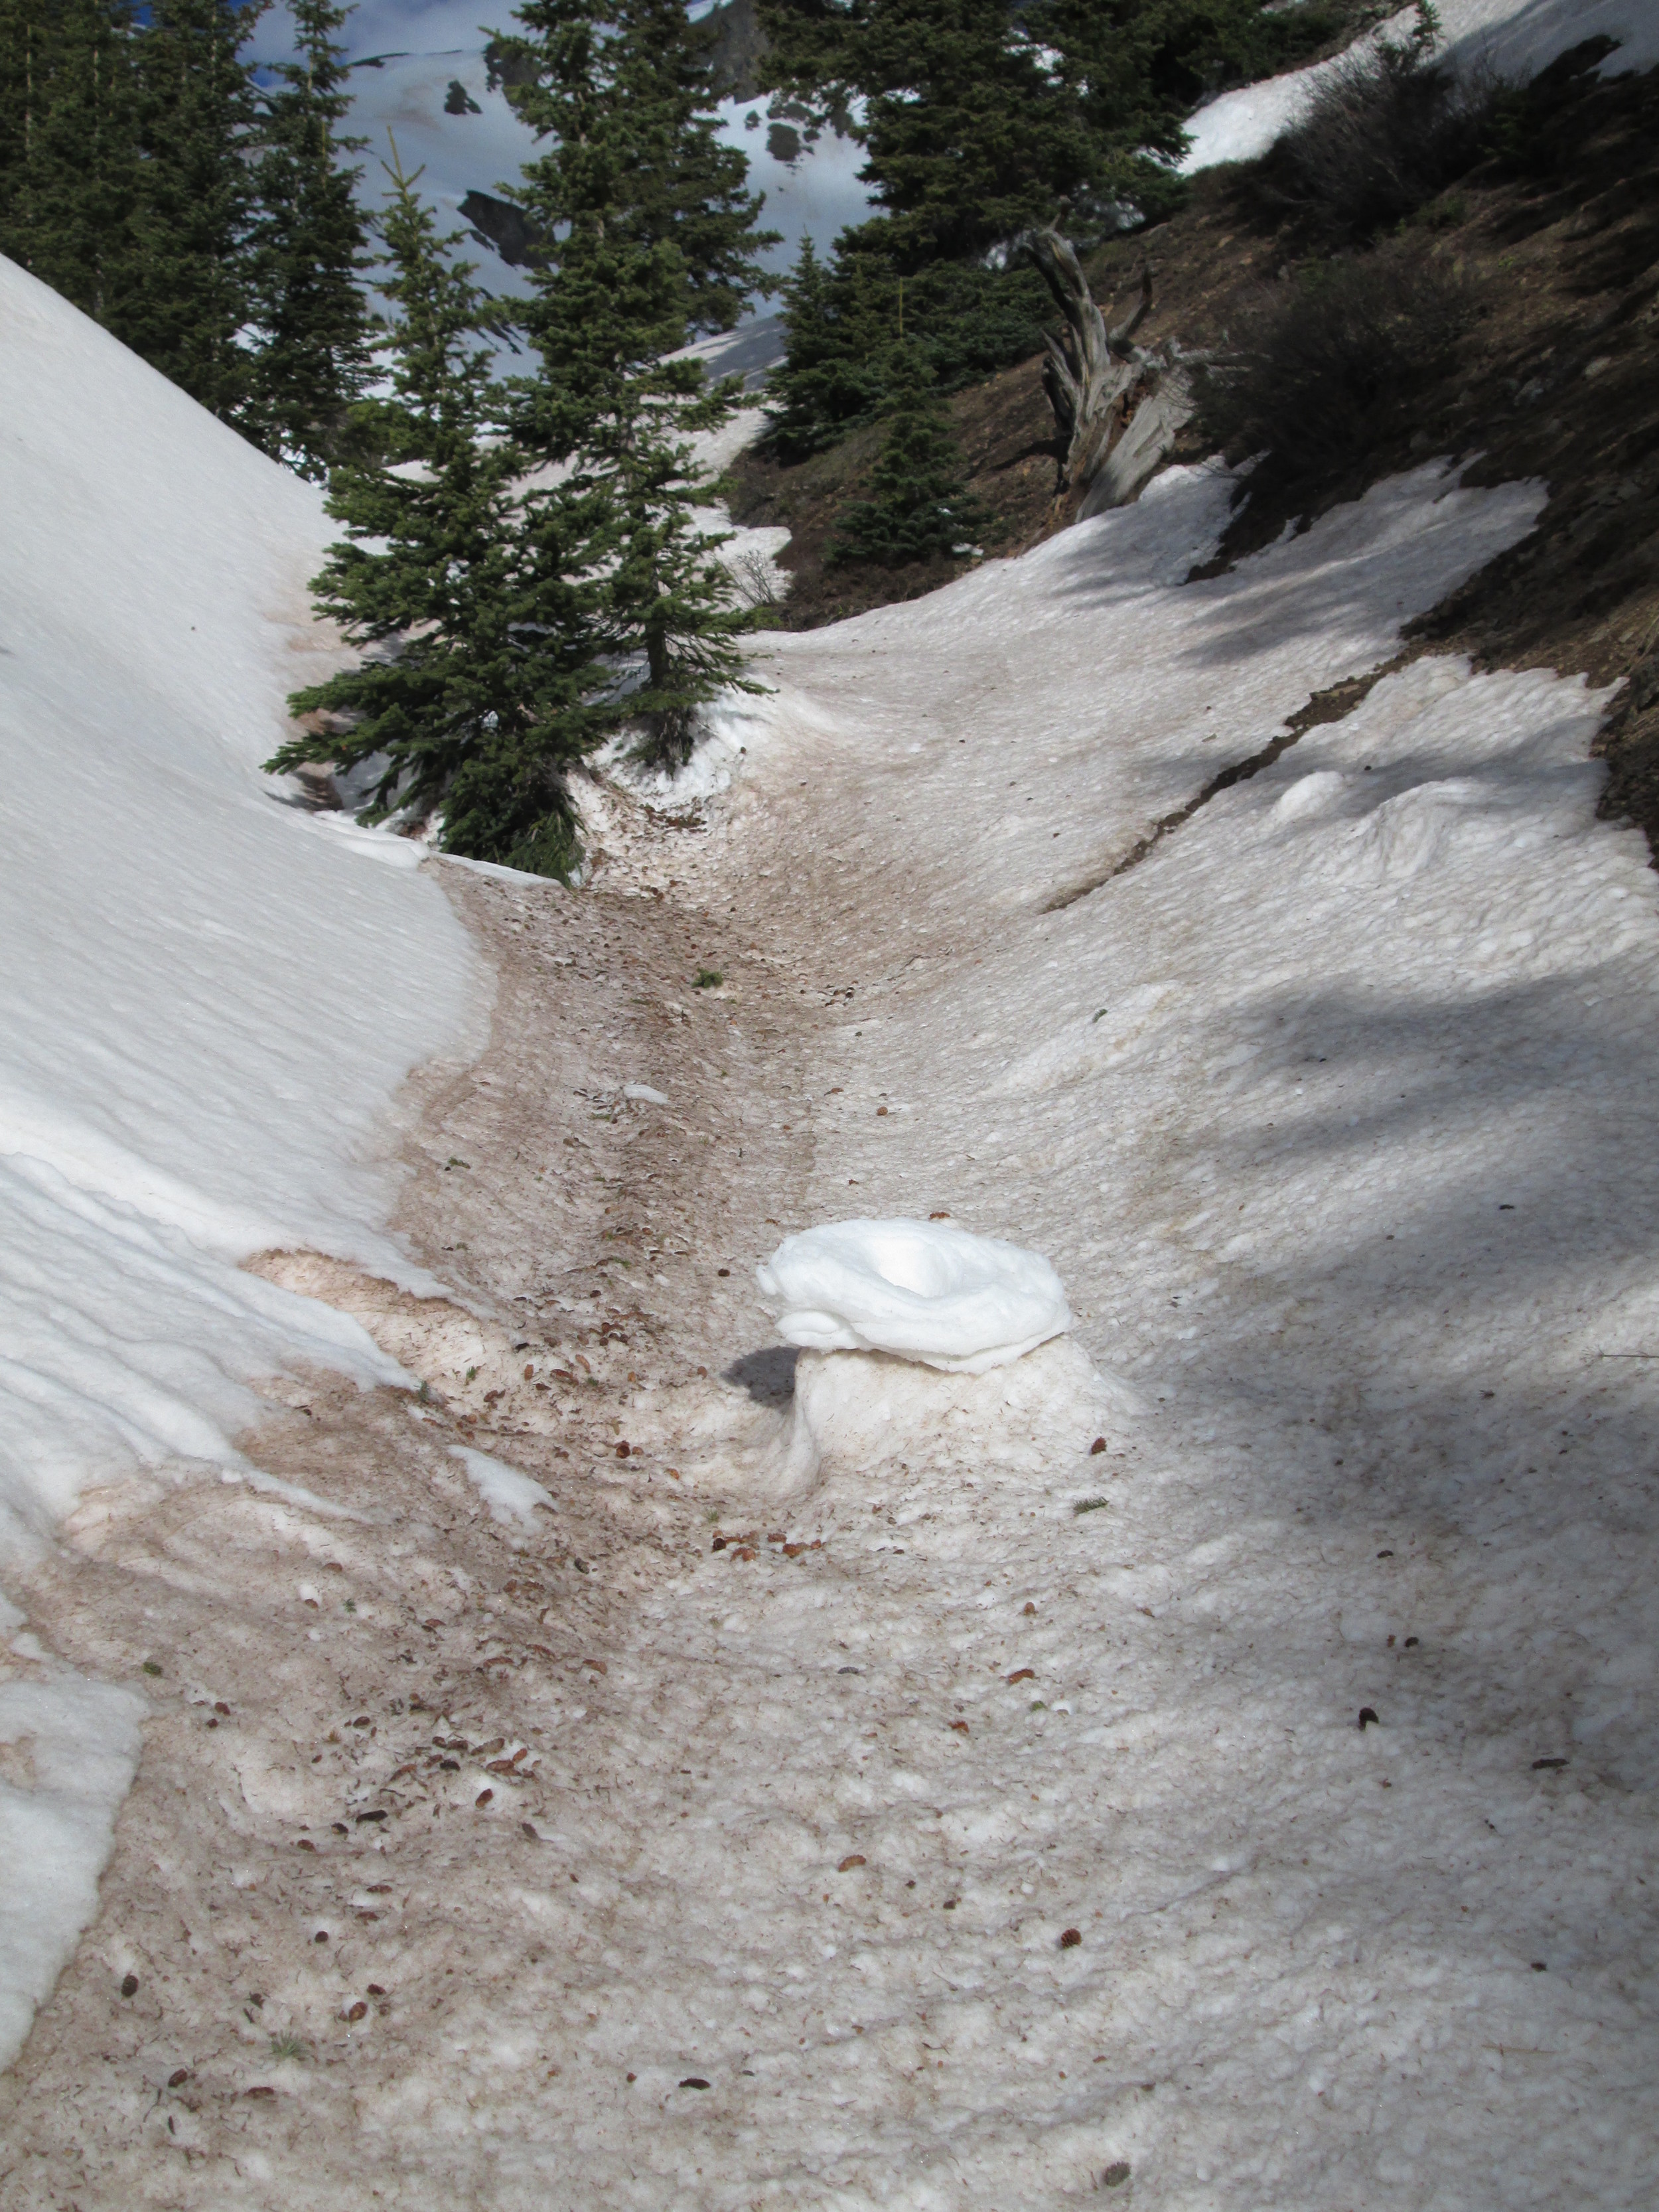
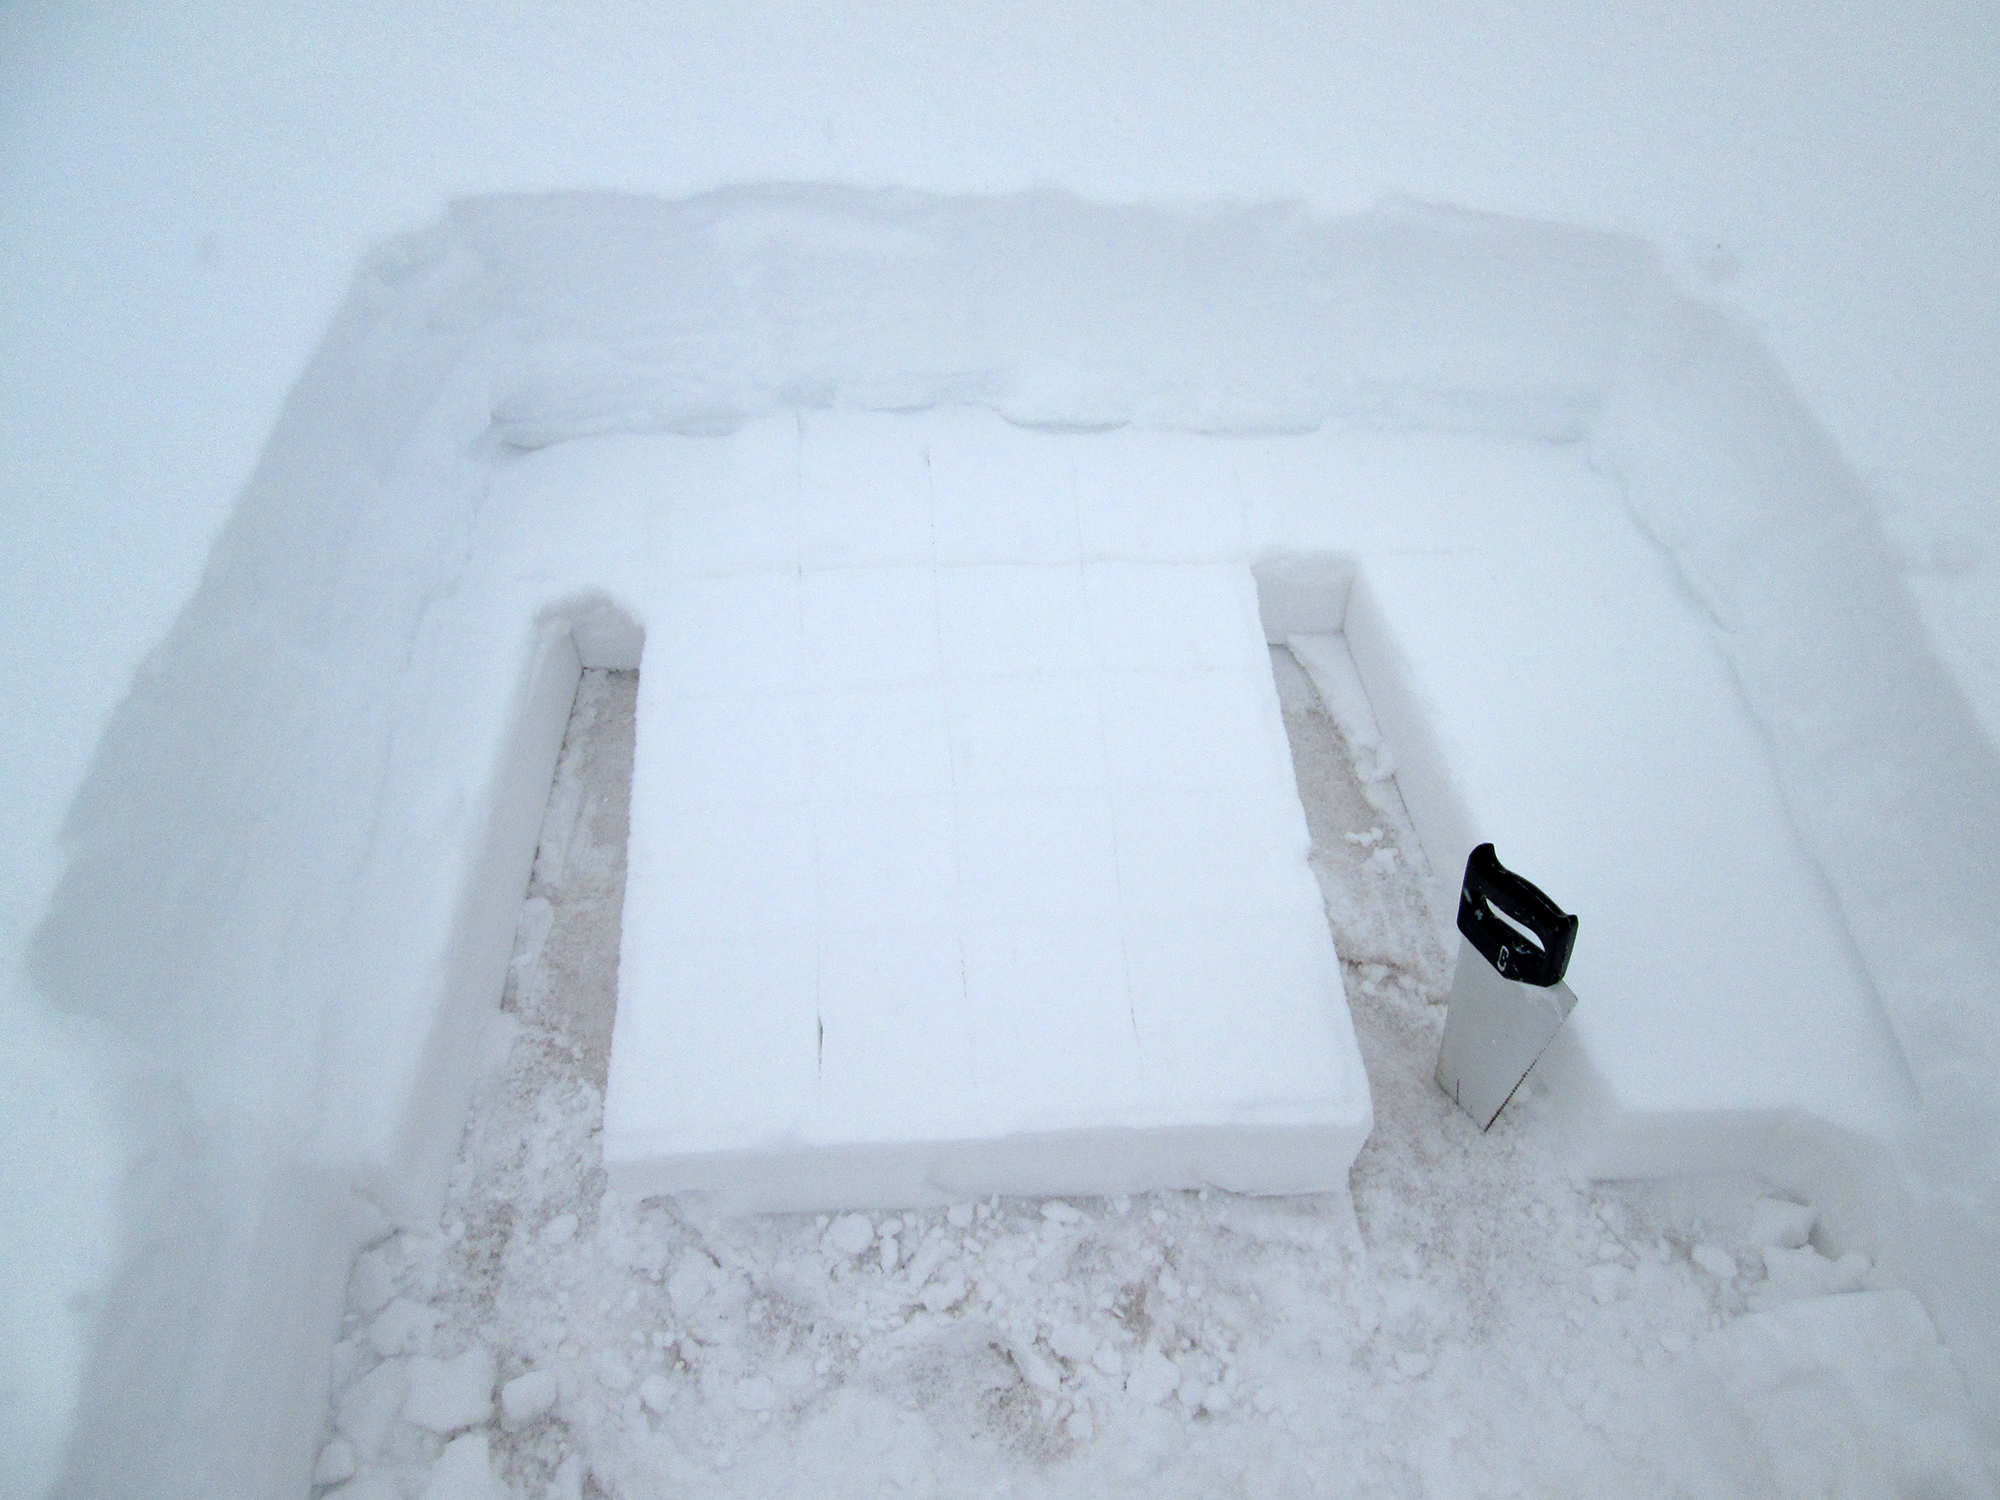
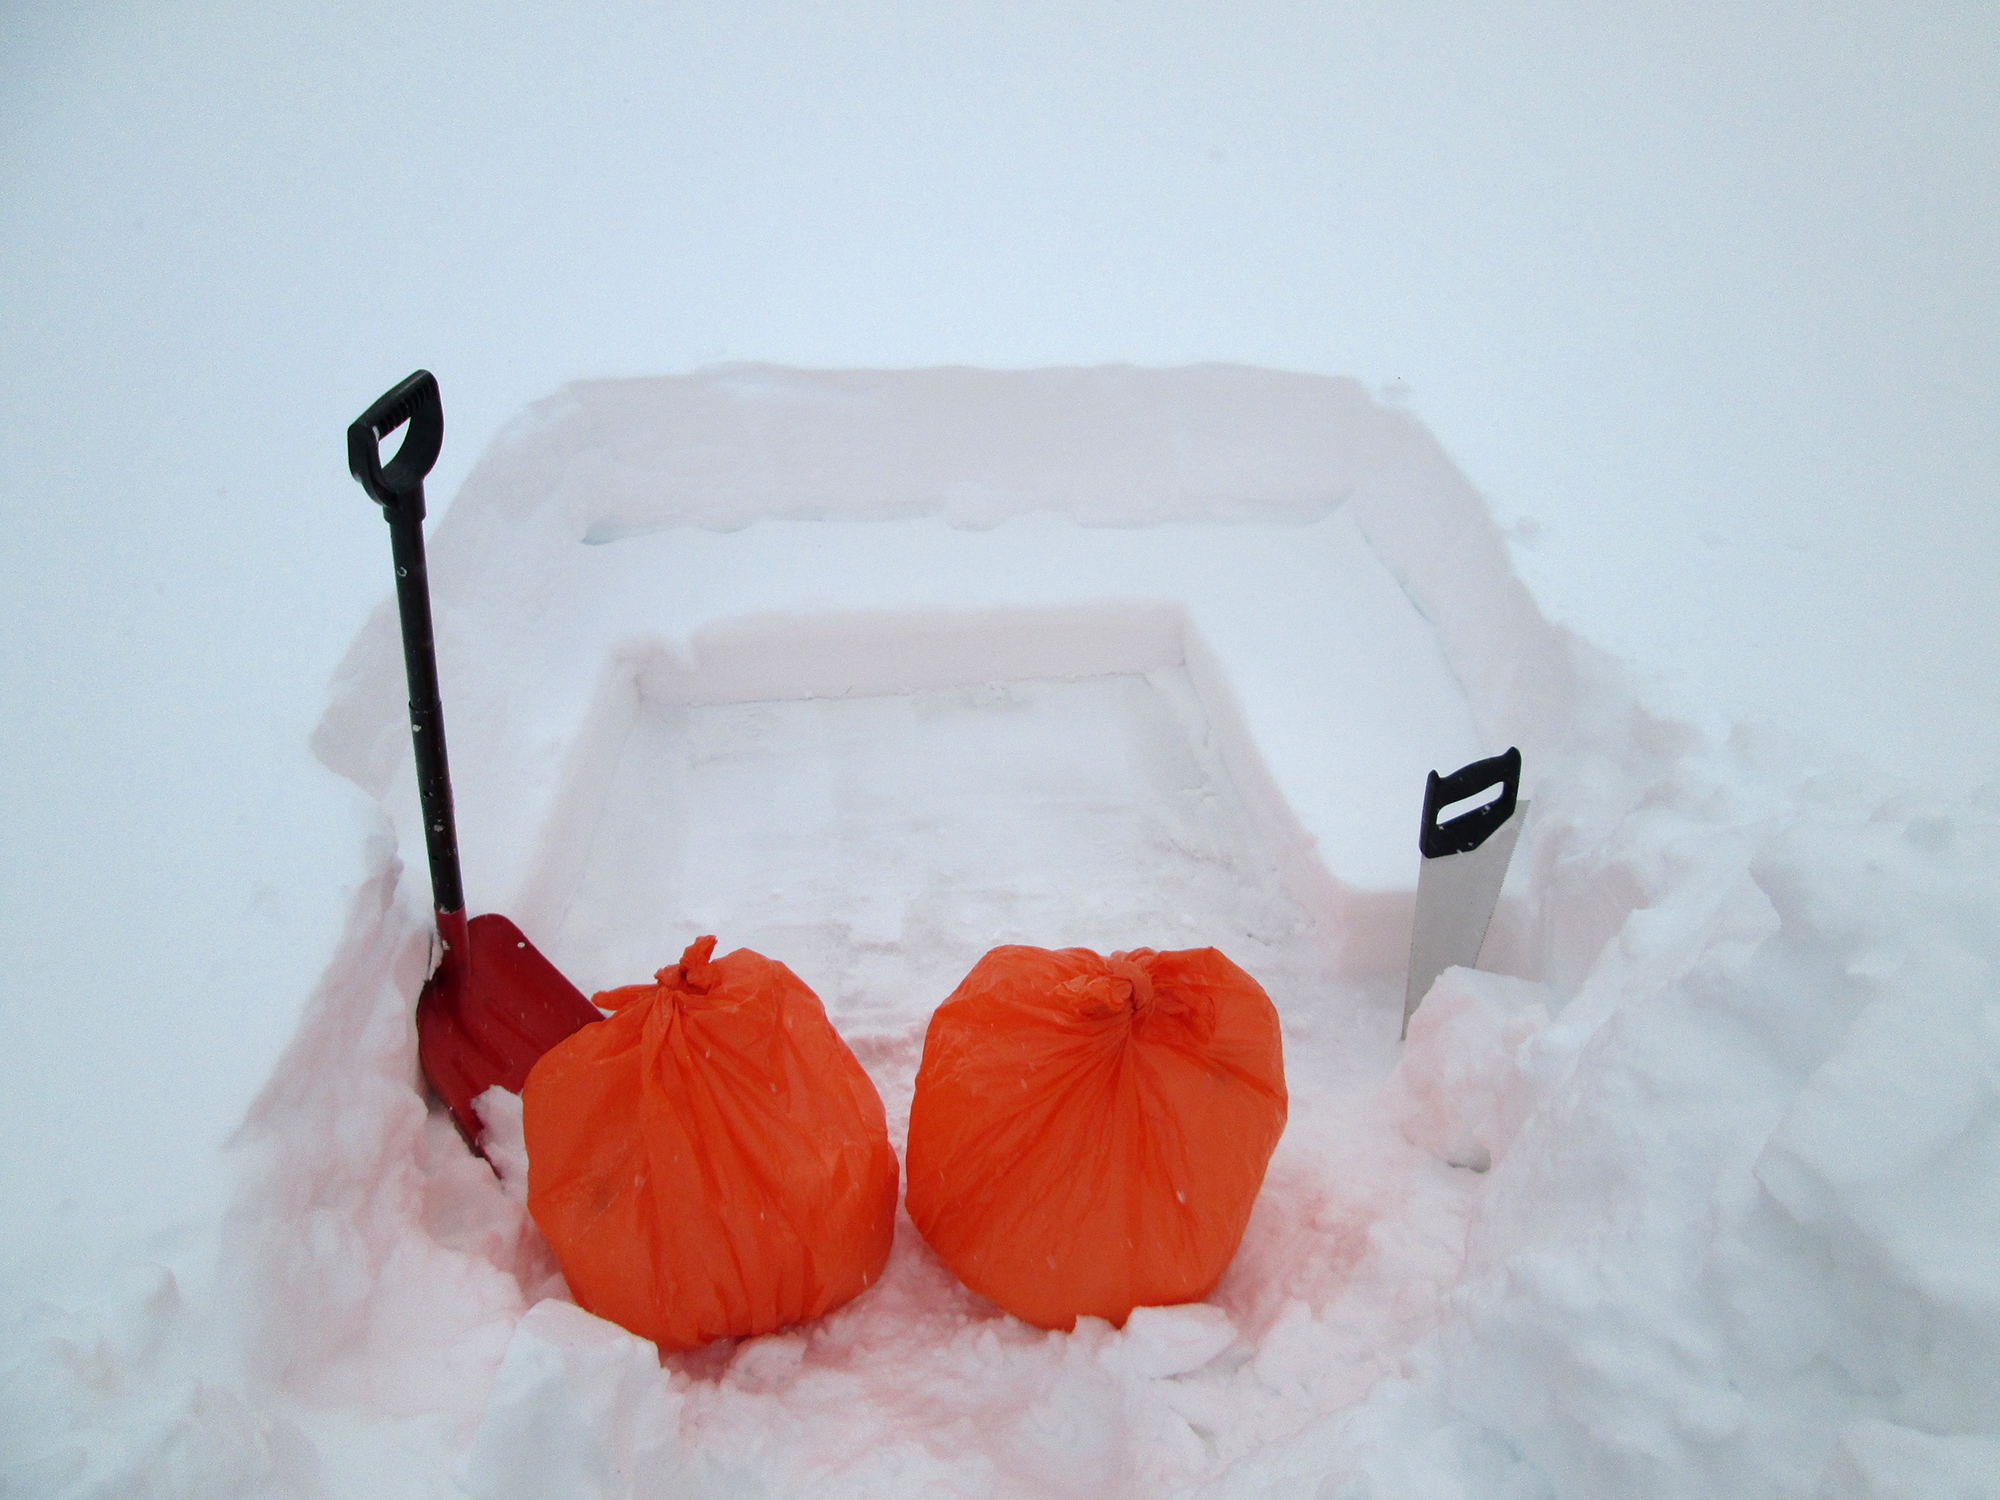
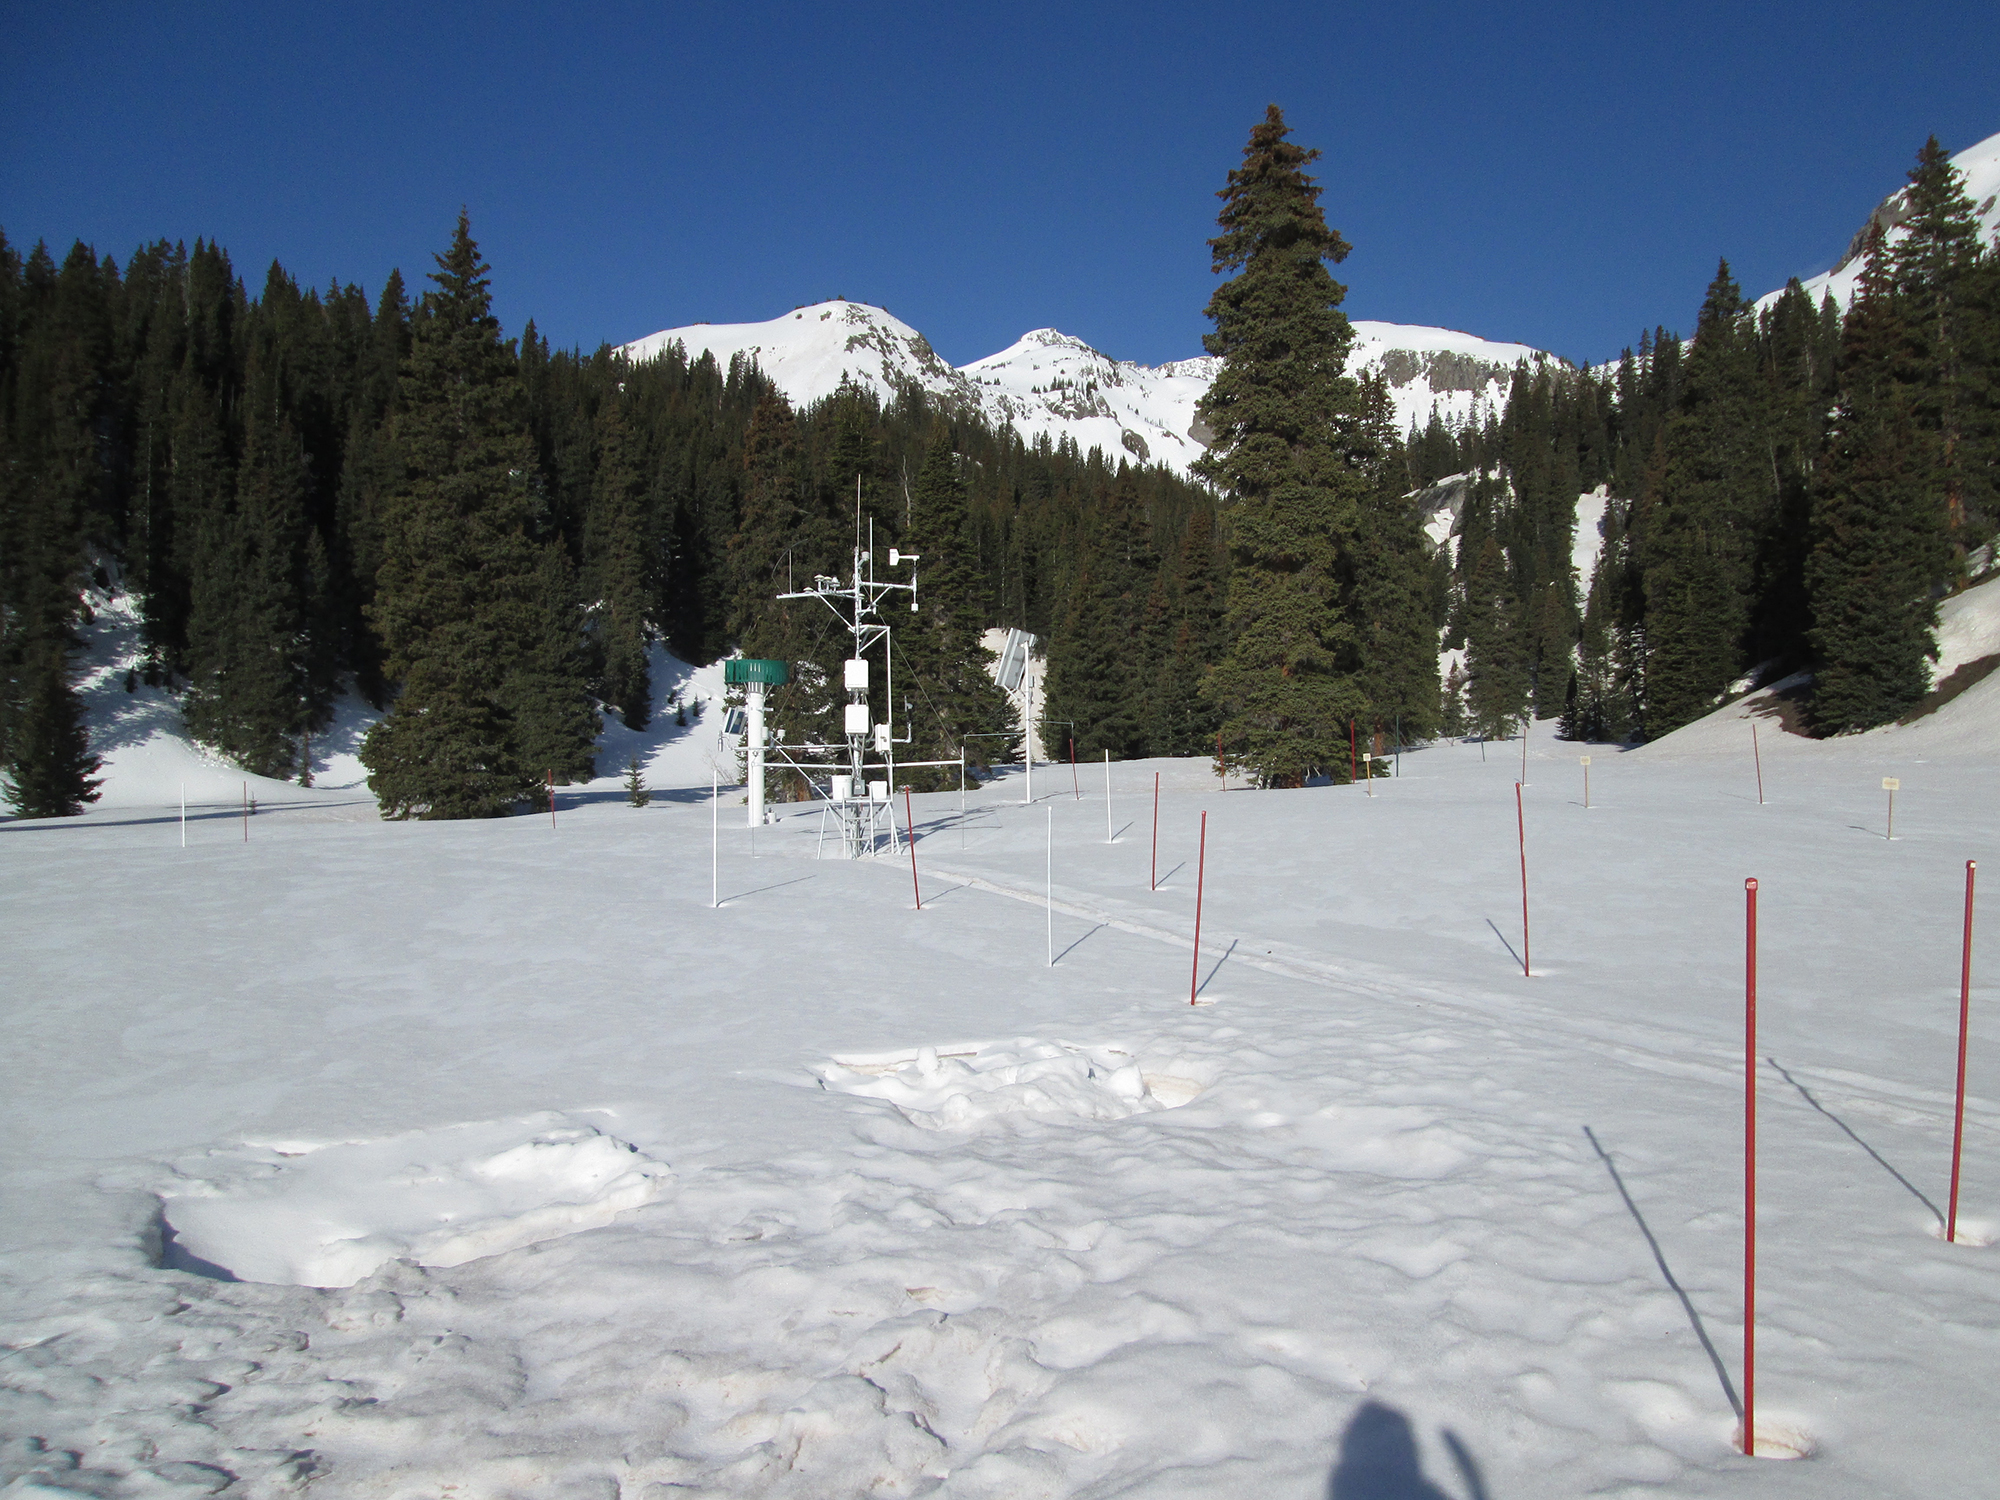
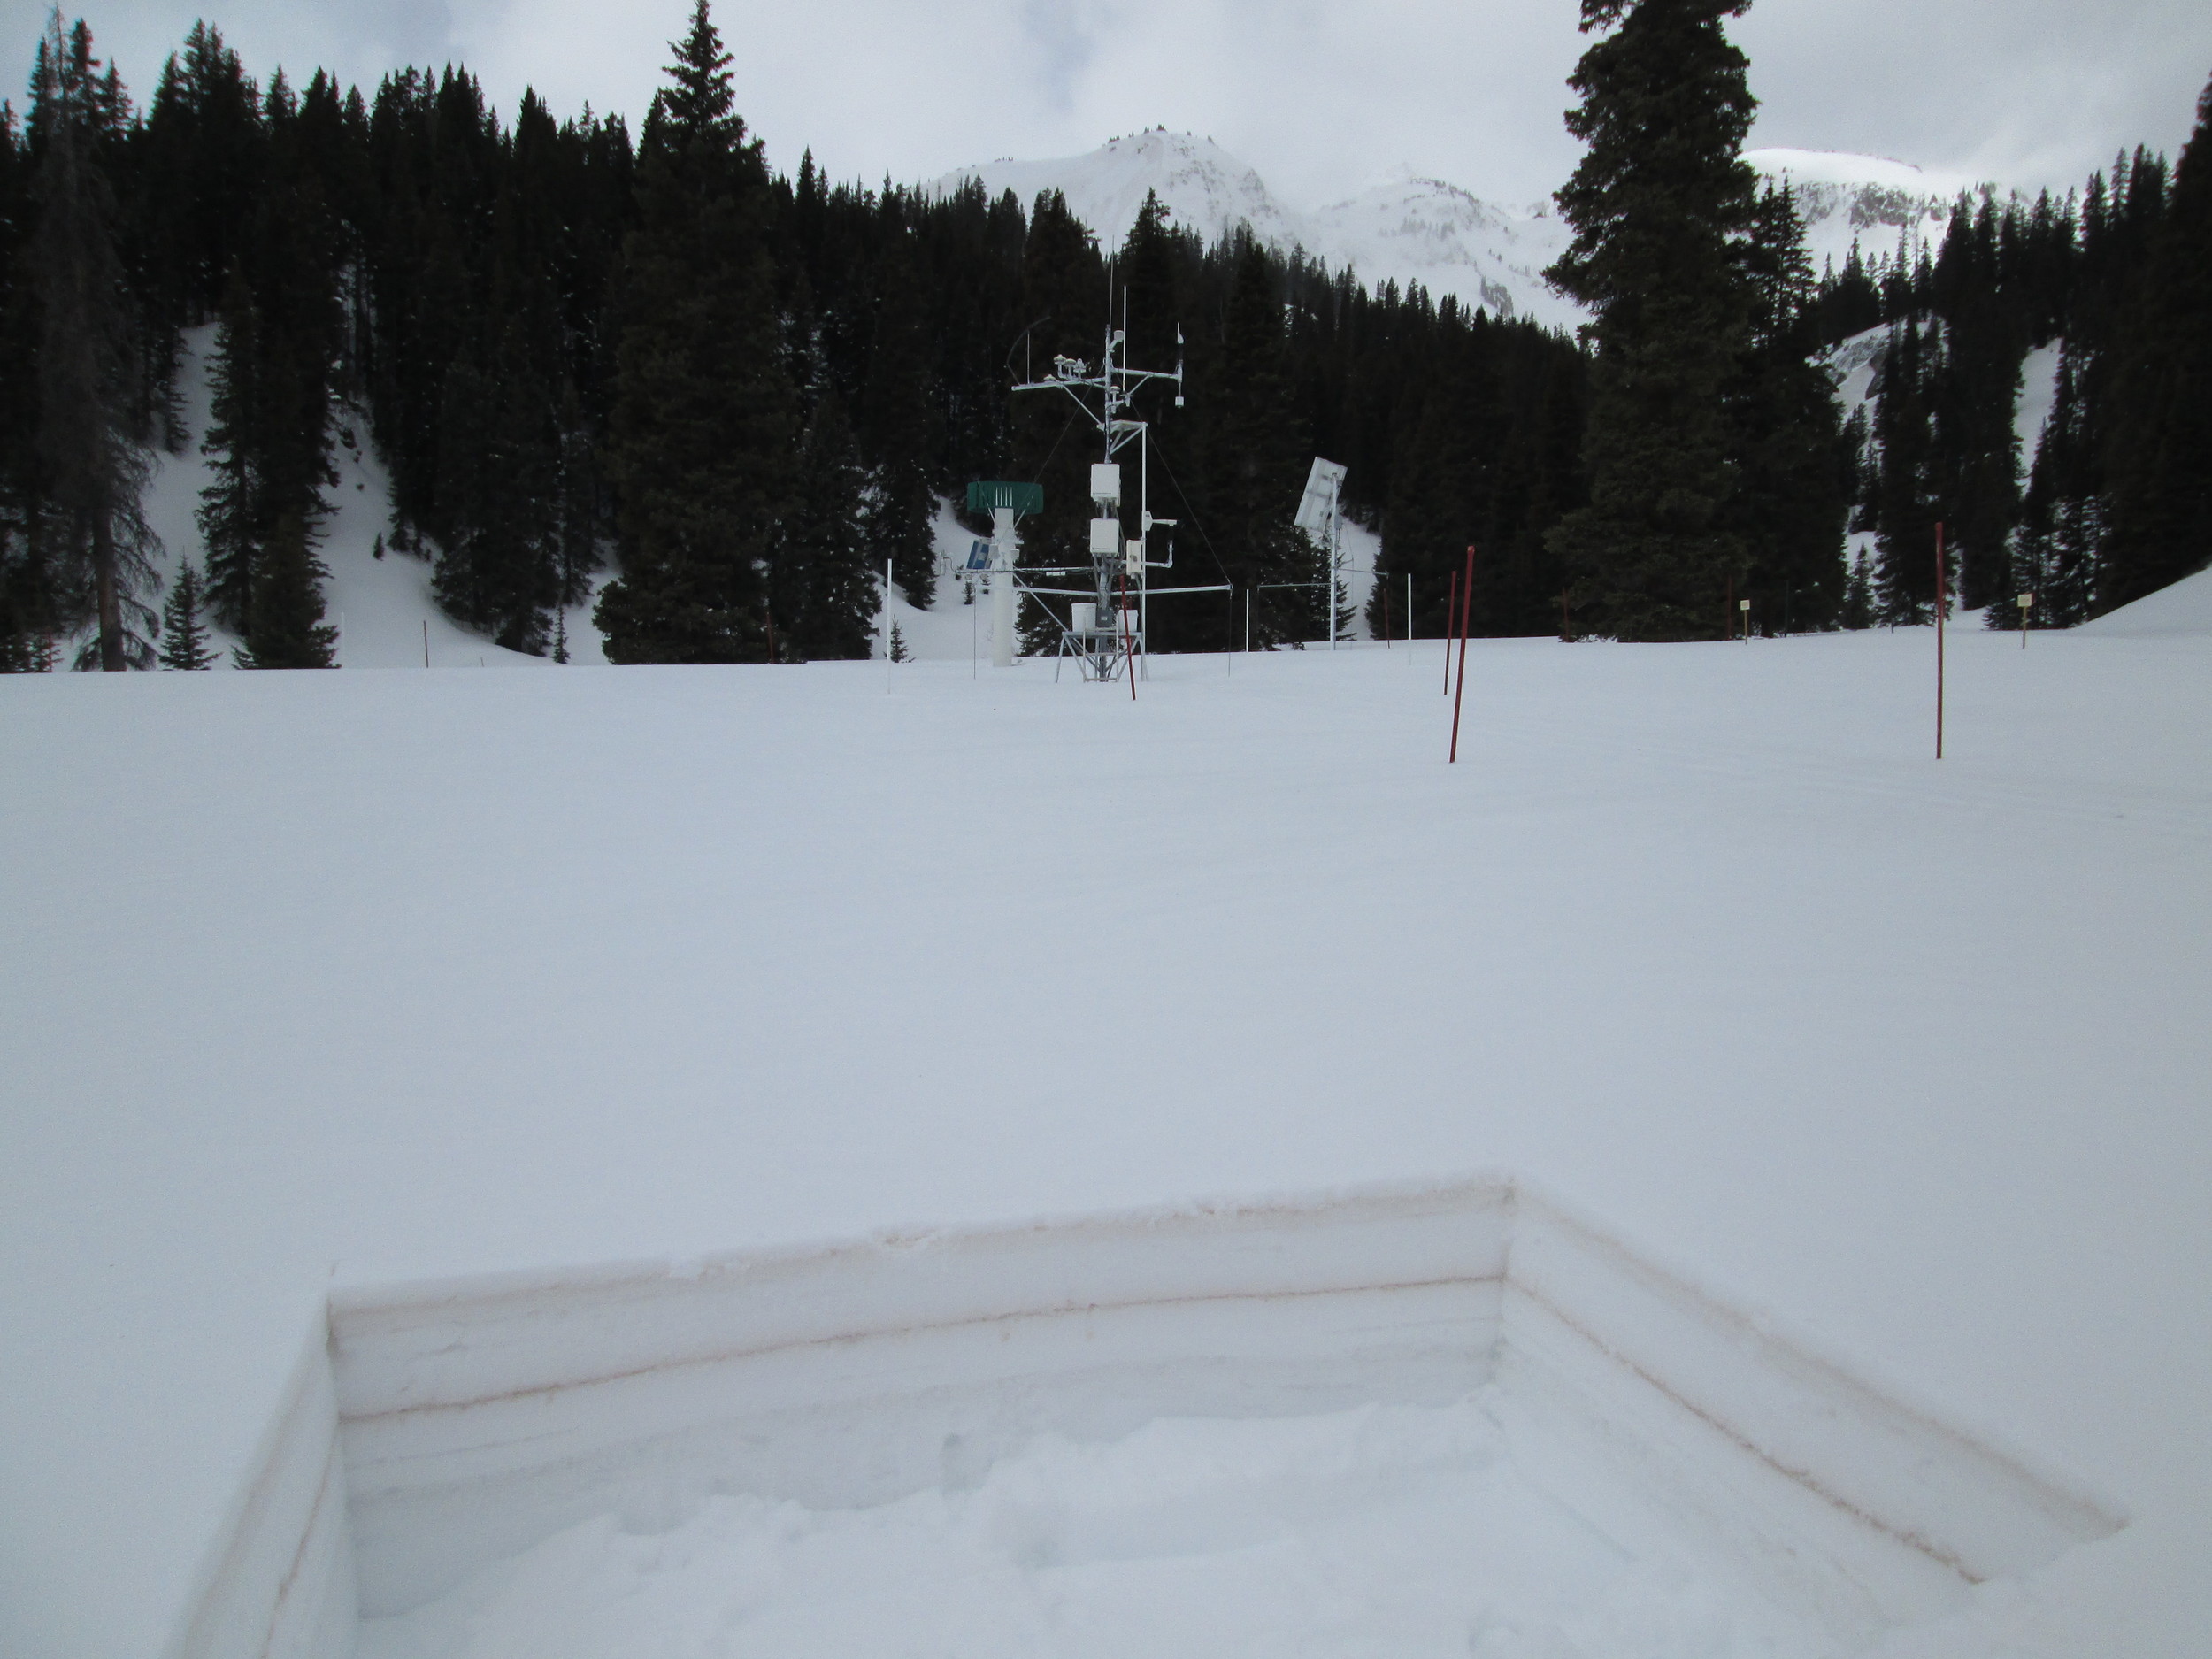
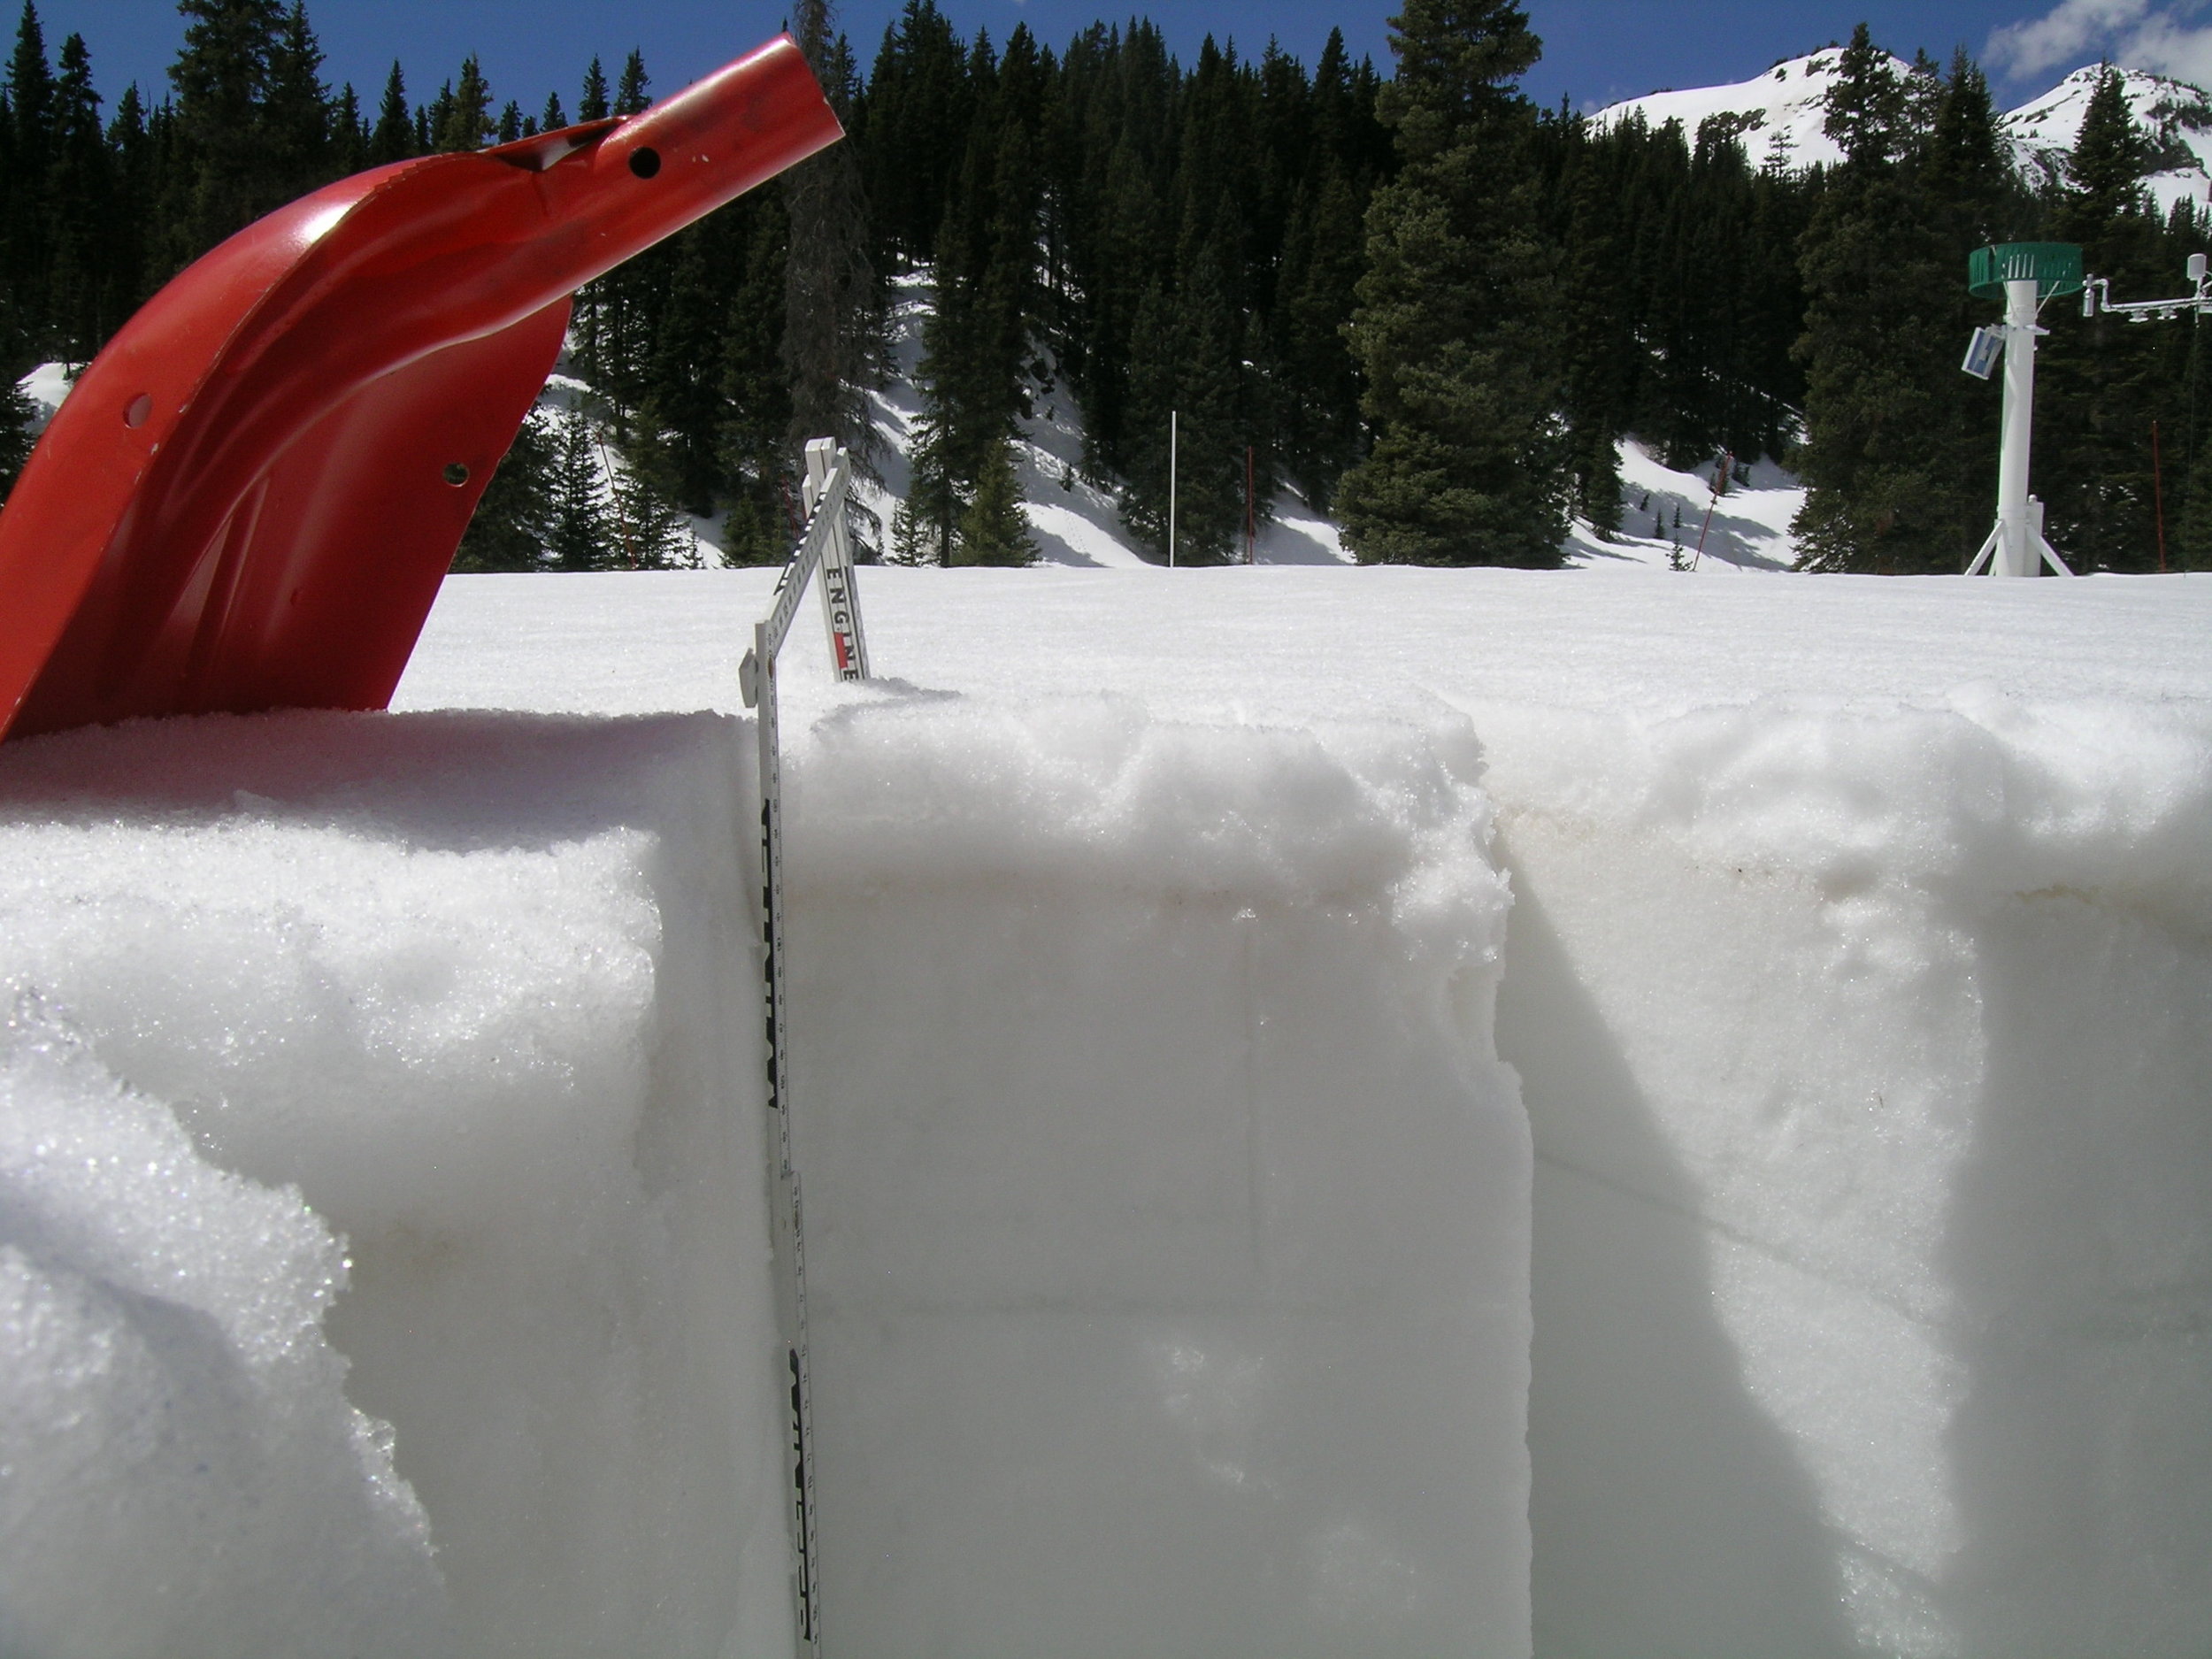
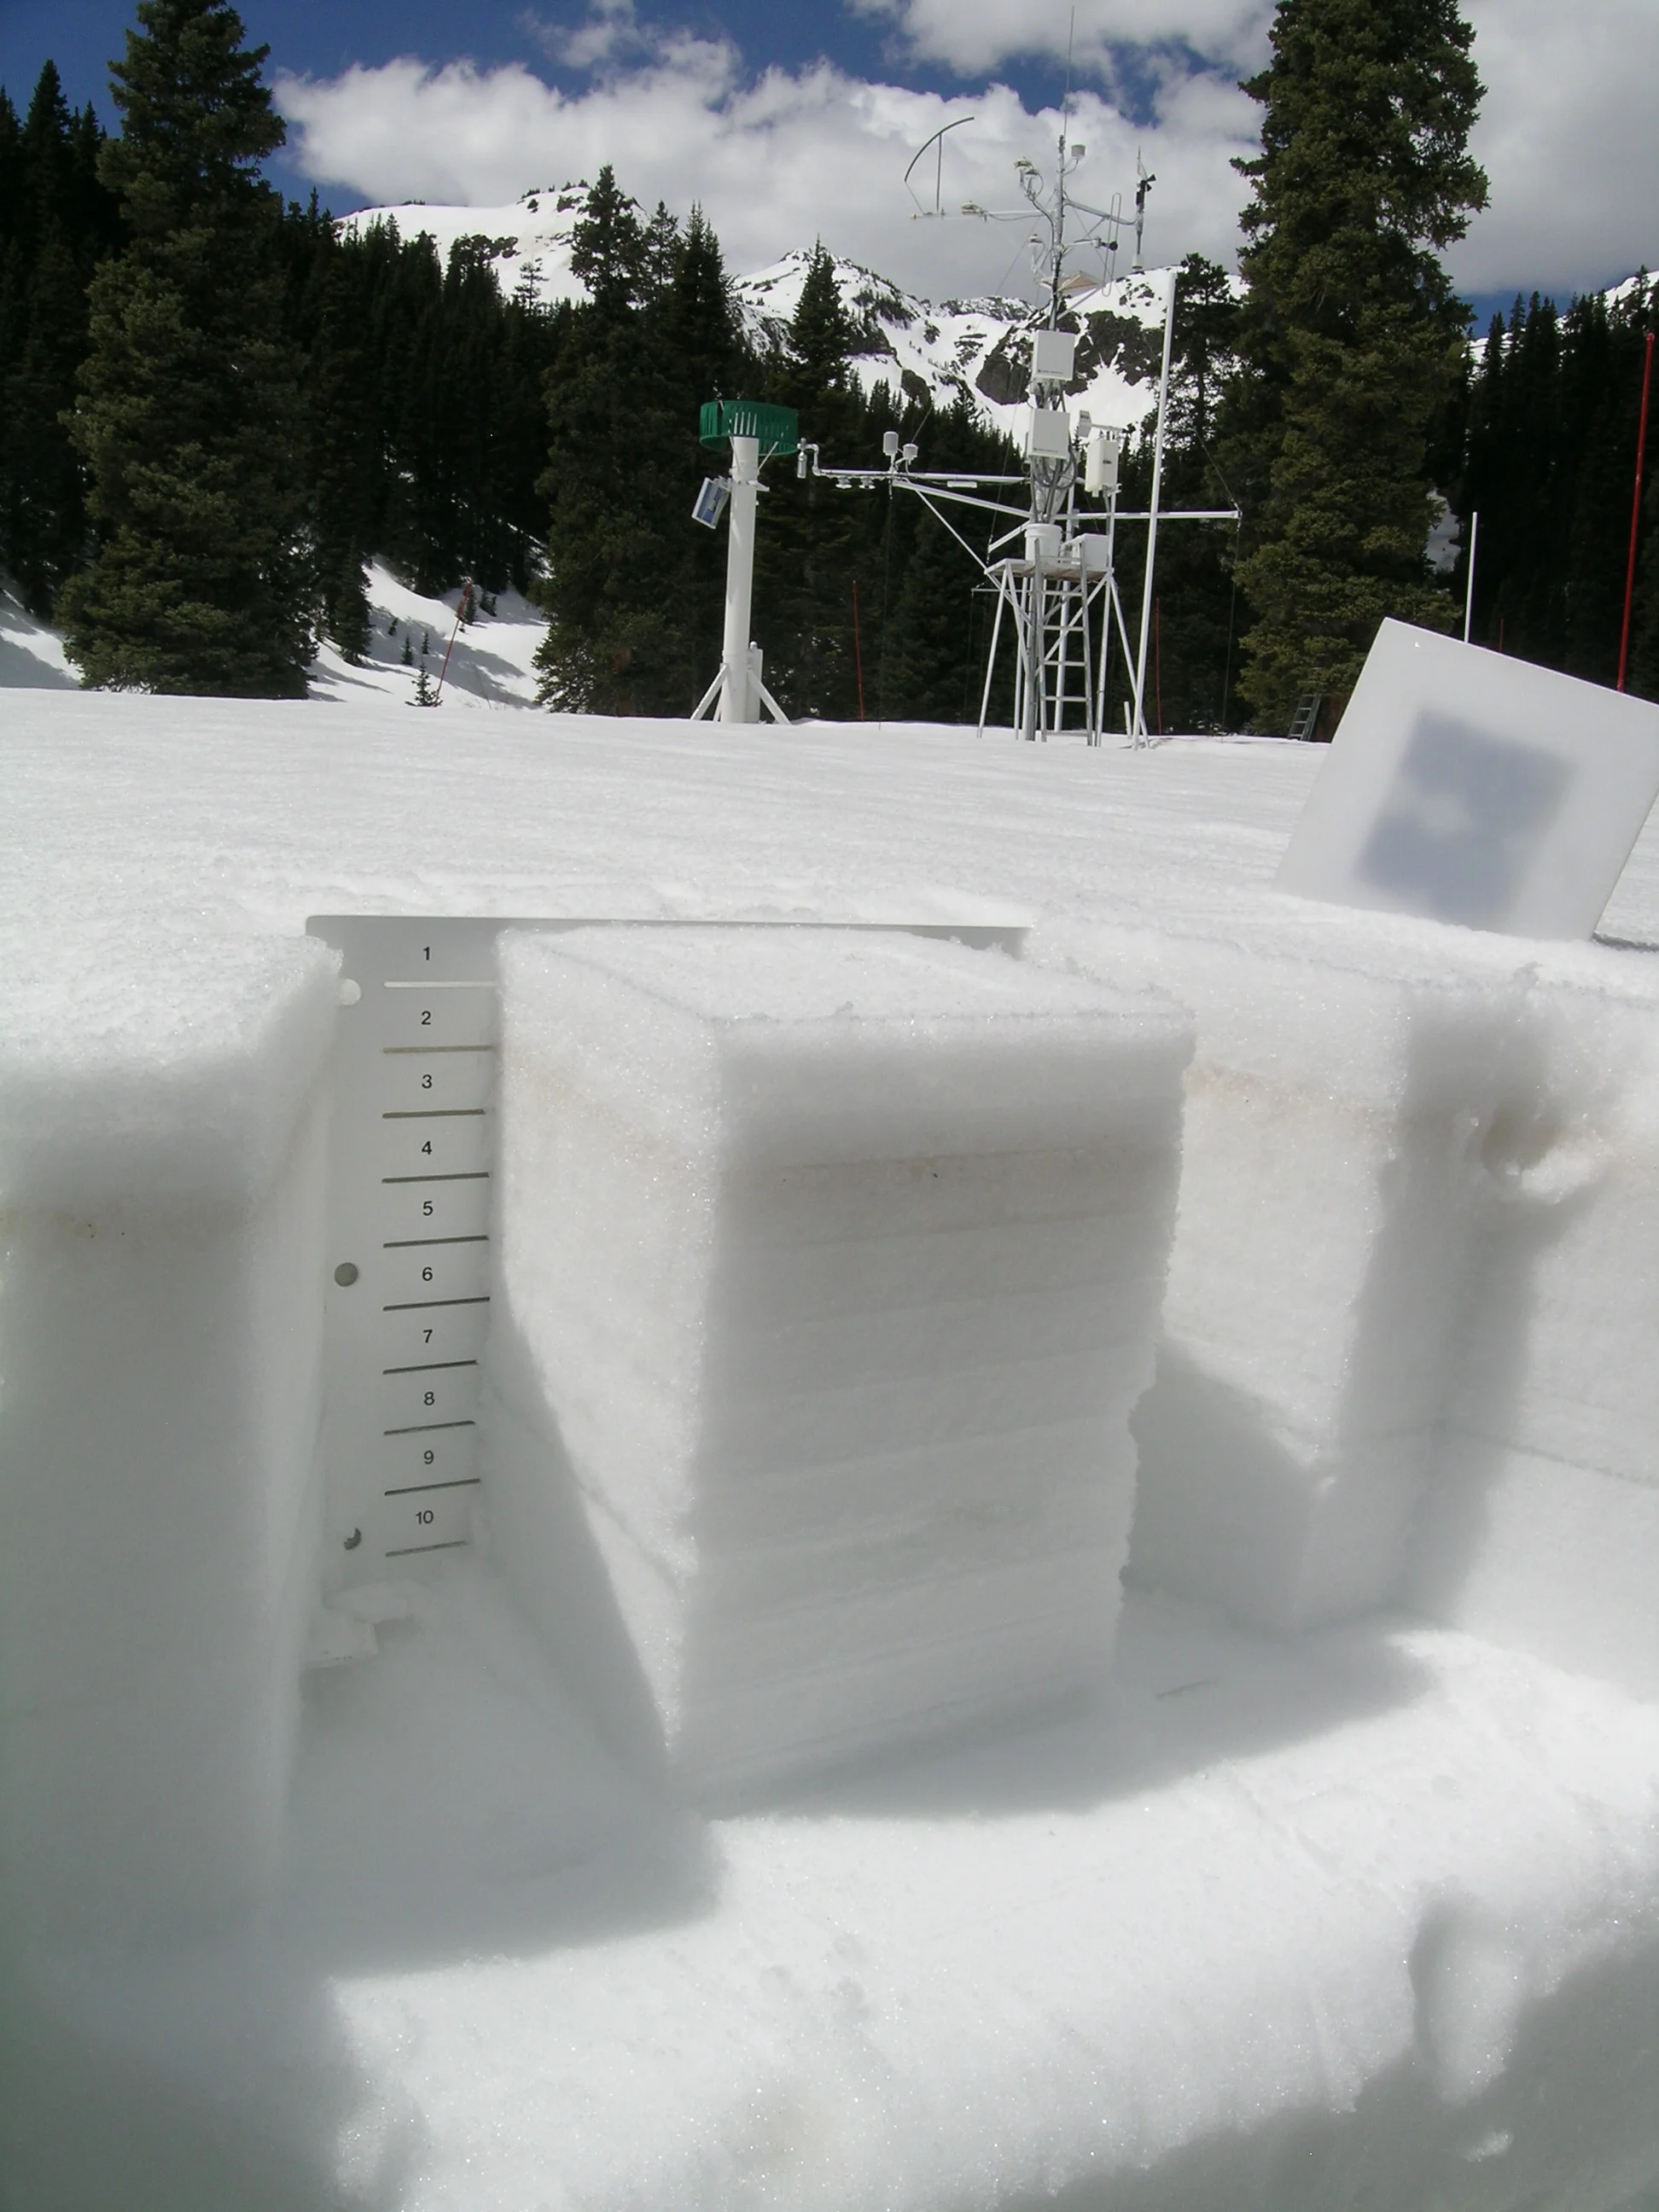
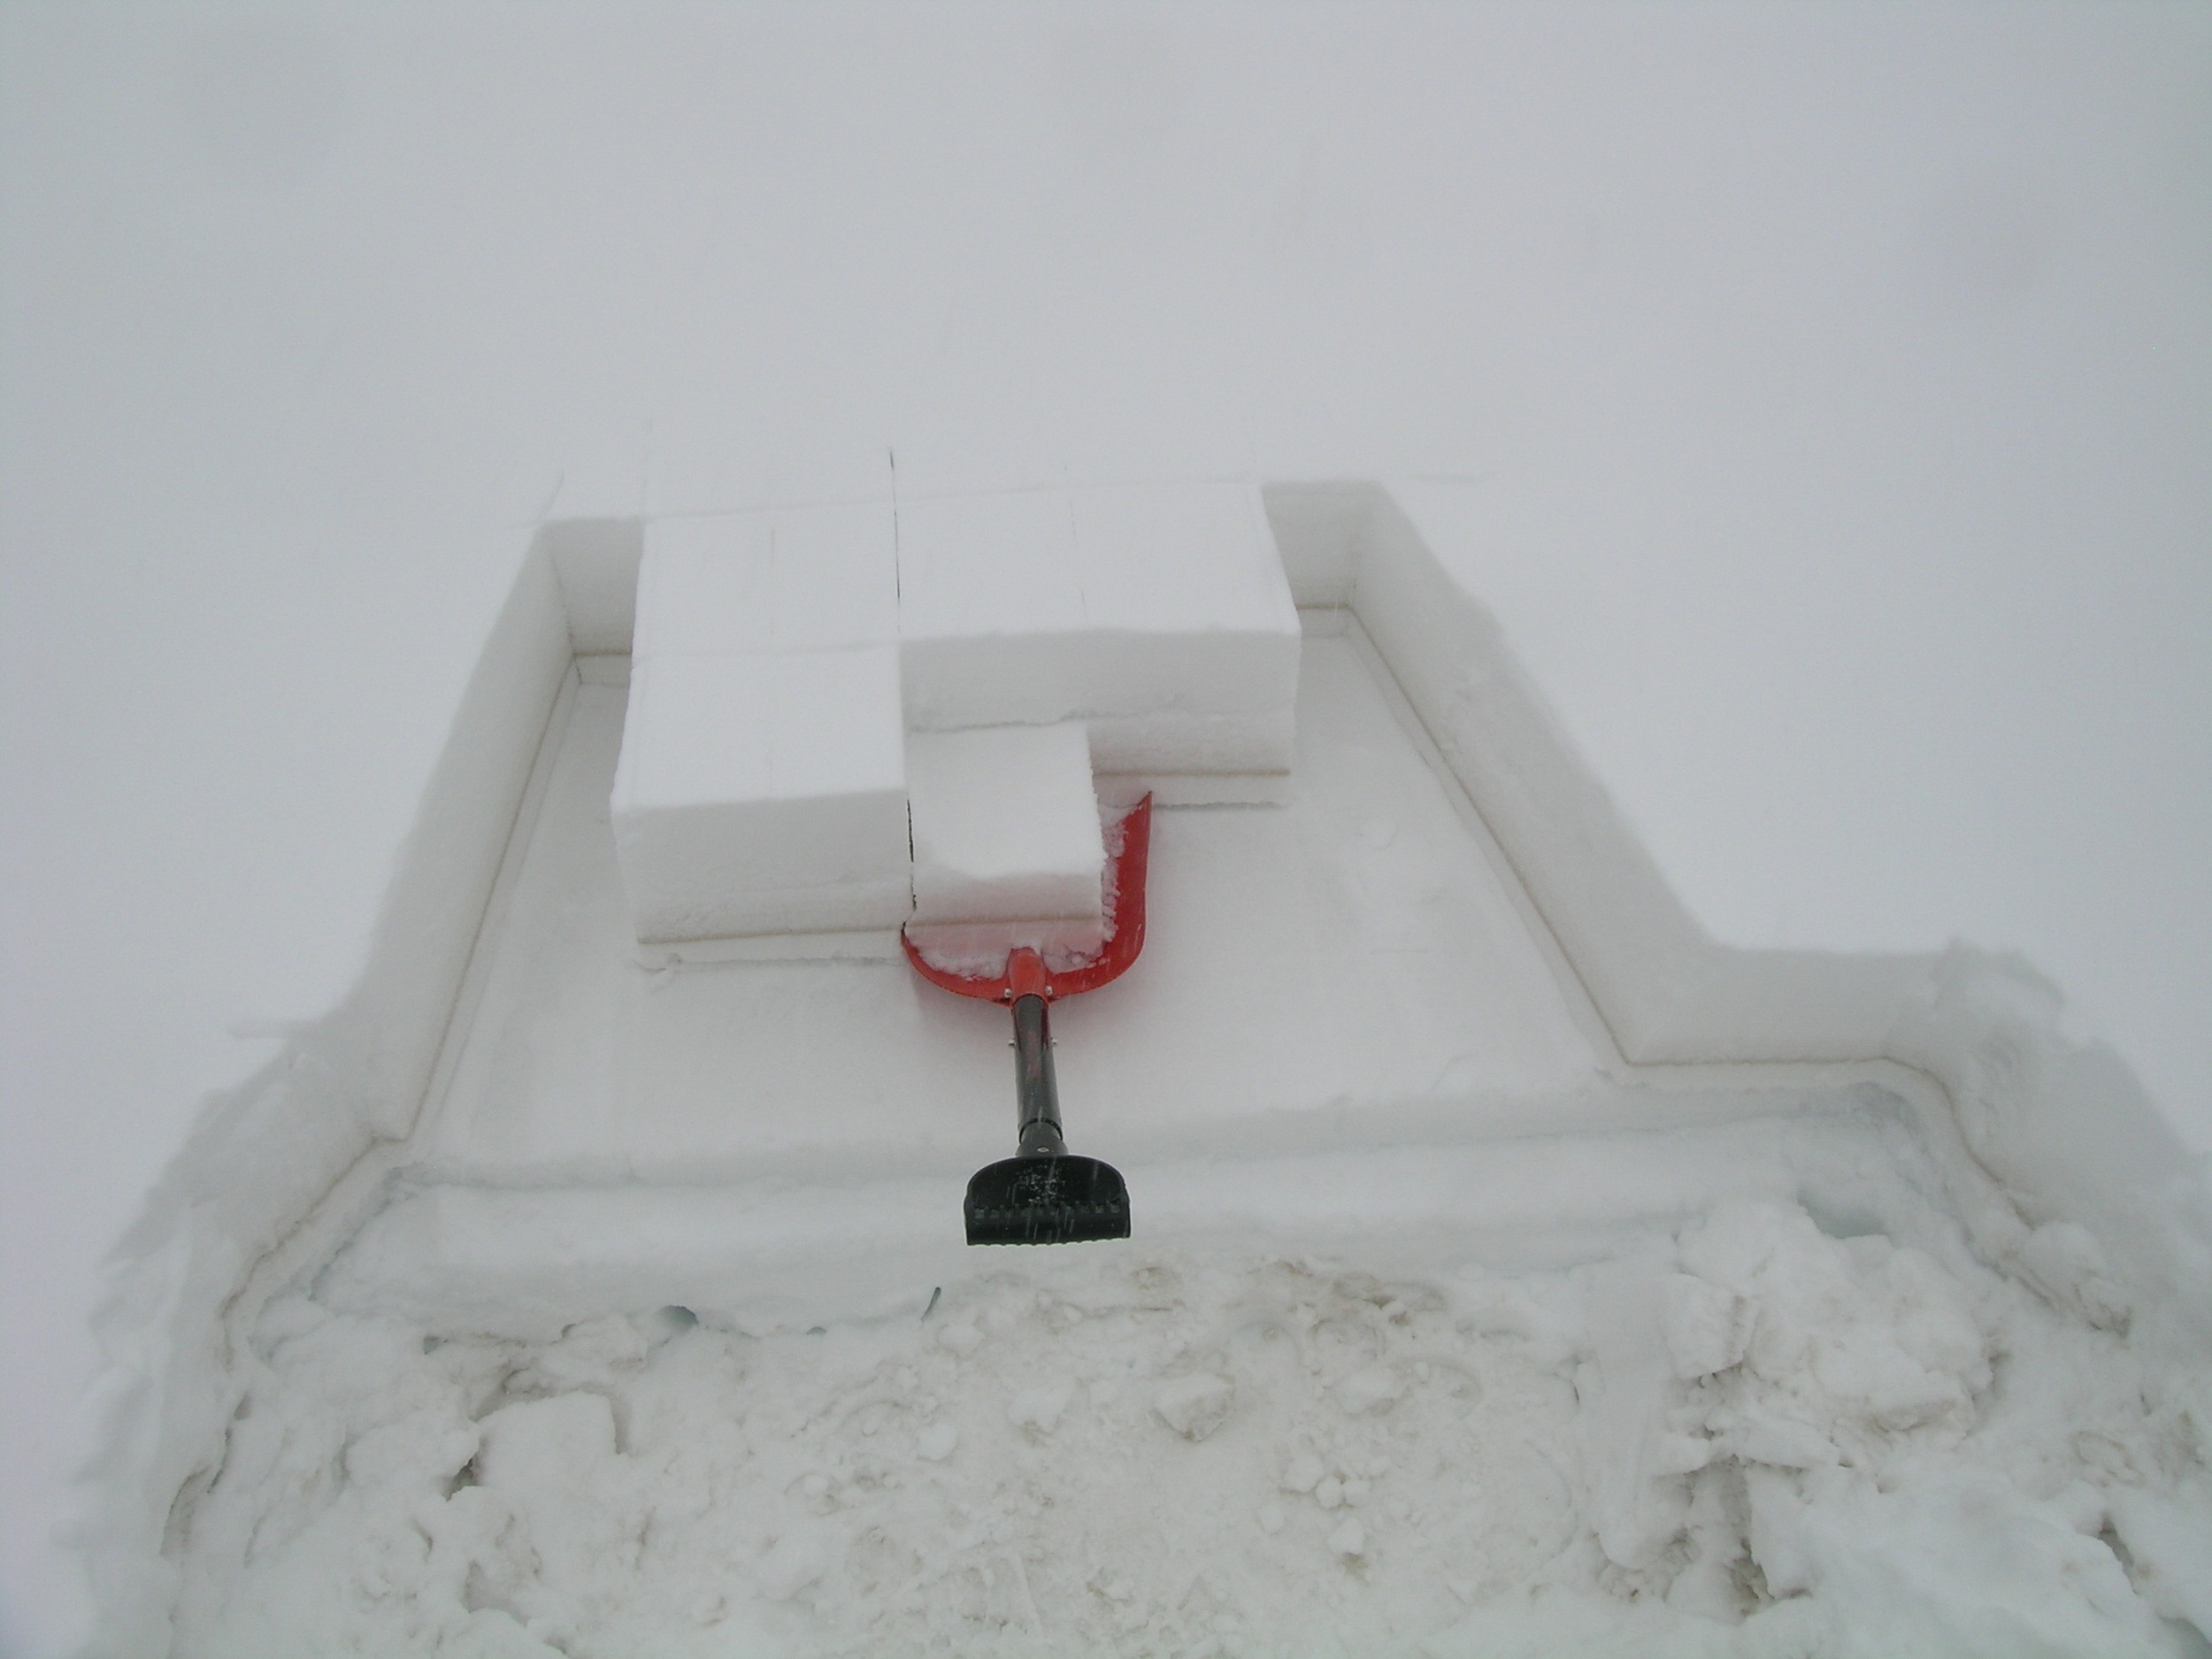
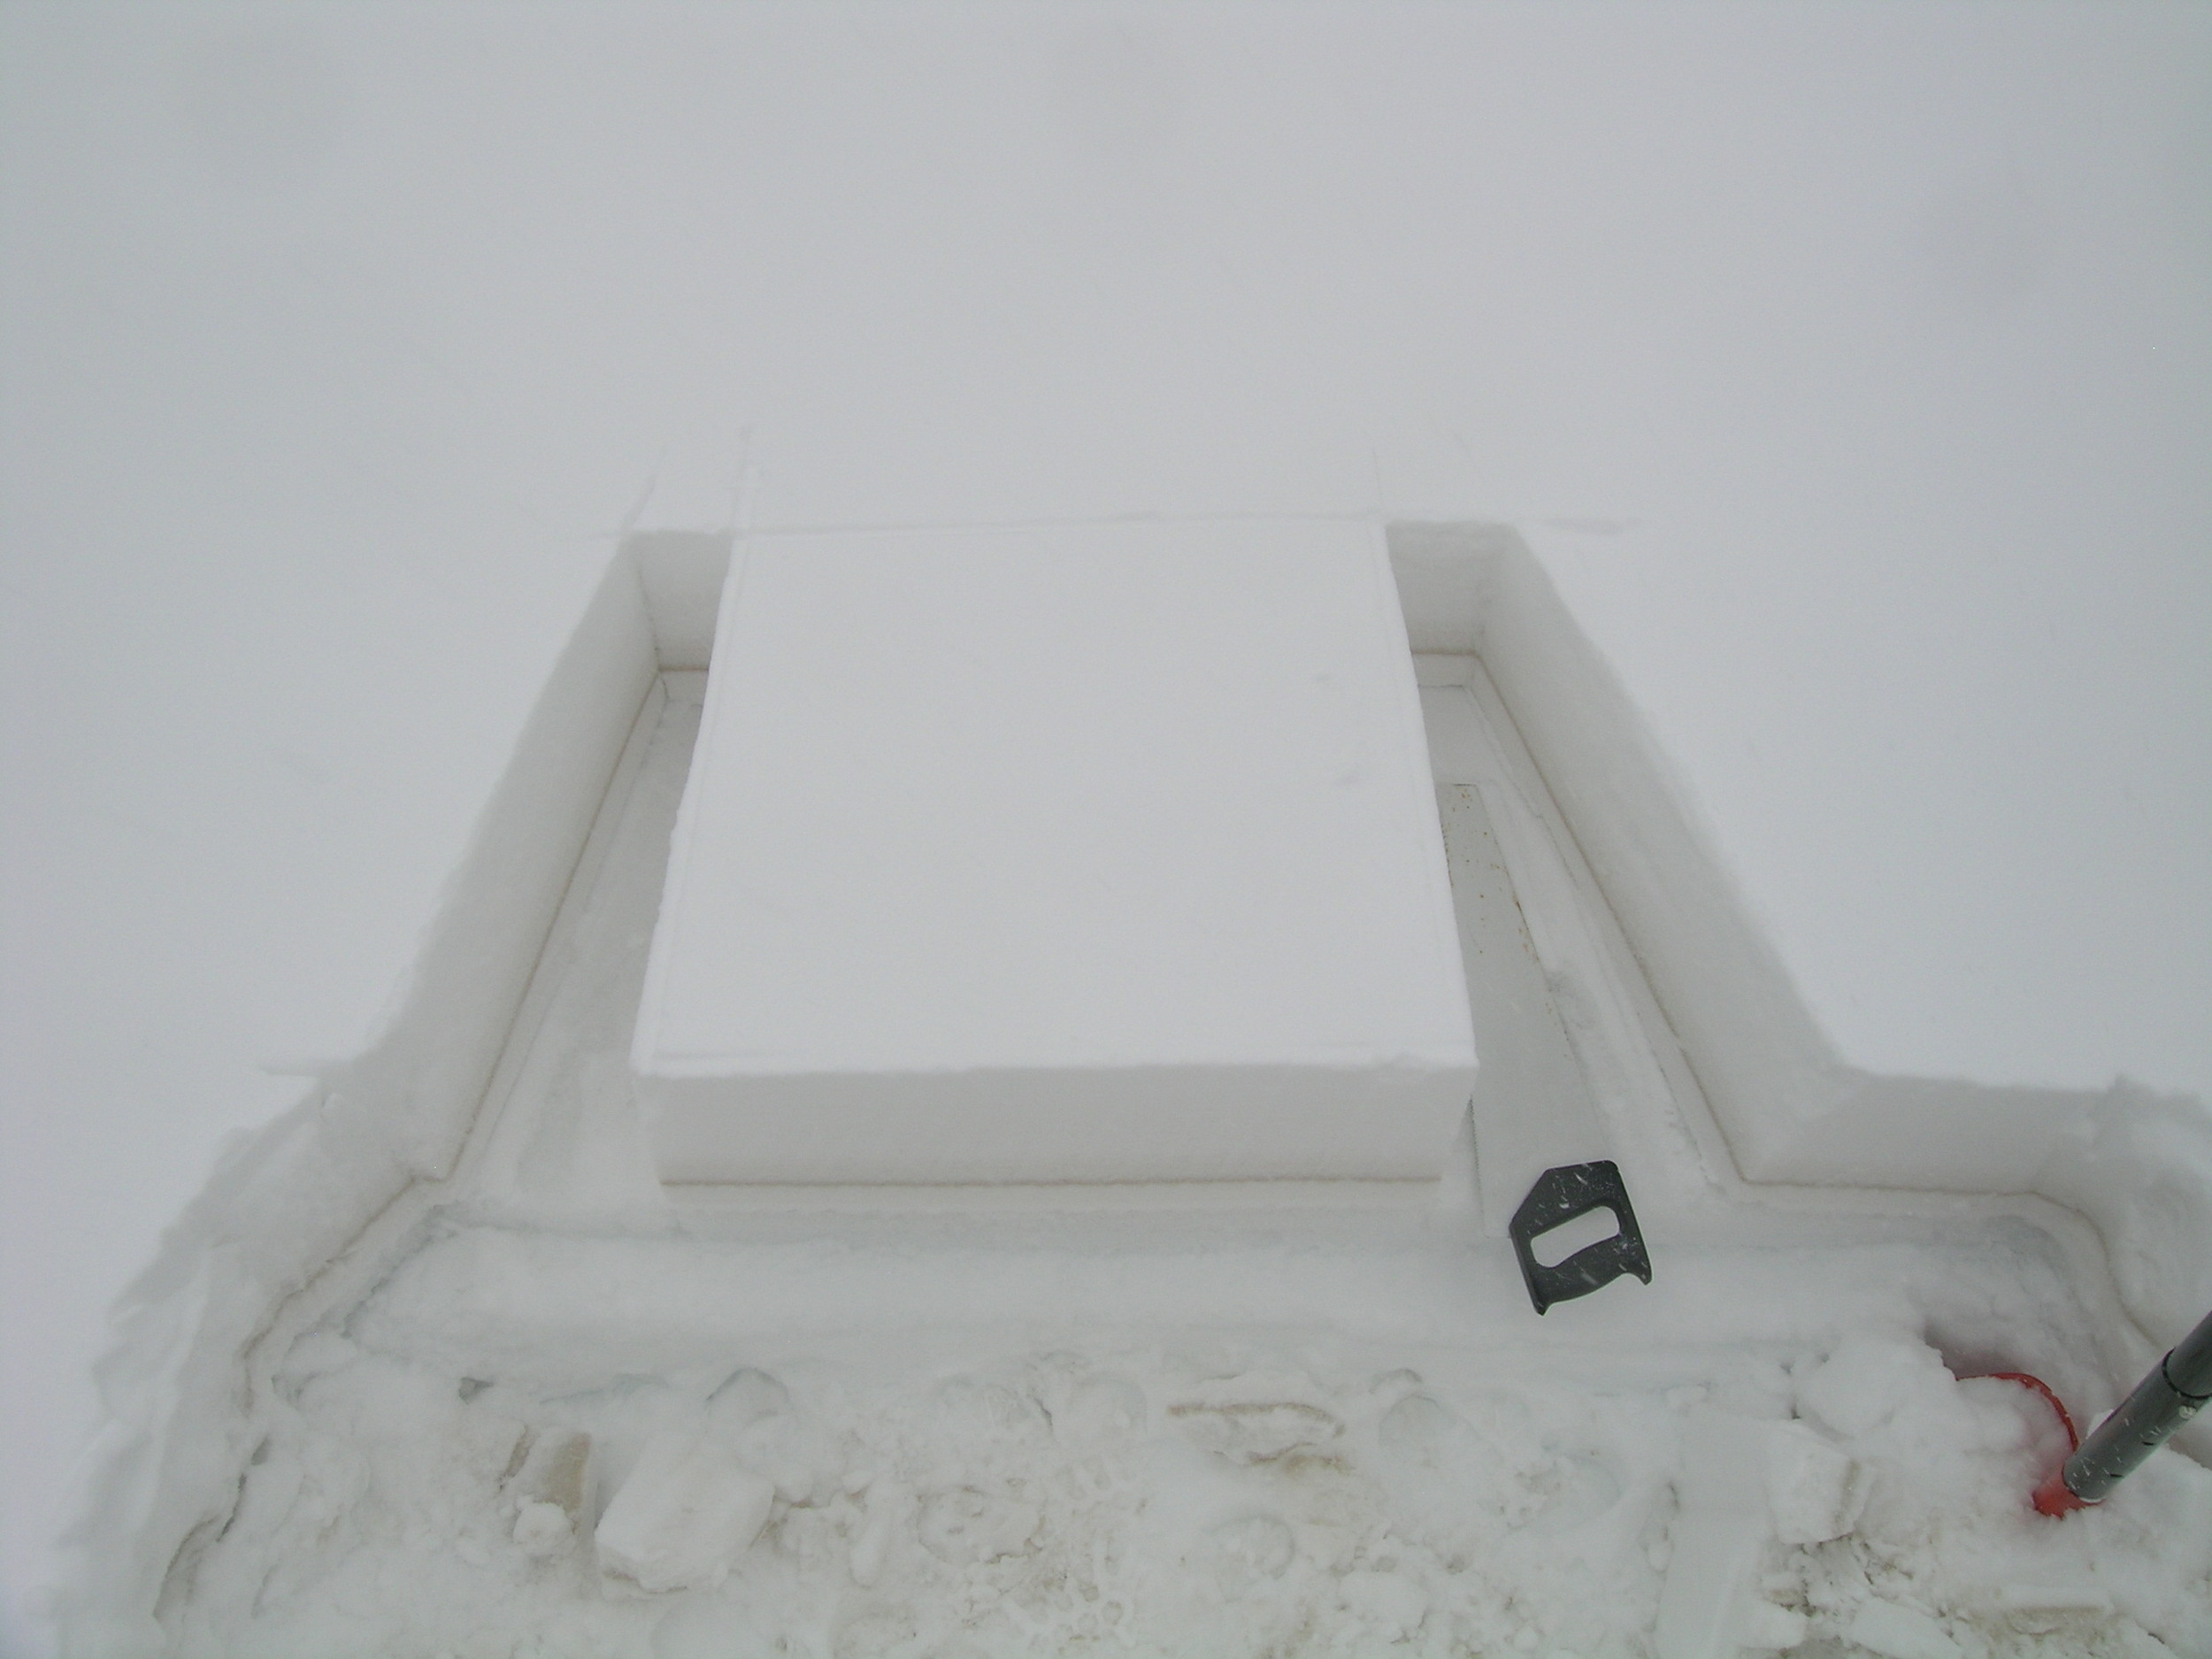
Photo Gallery
for Senator Beck Basin
Photo Gallery
for Senator Beck Basin
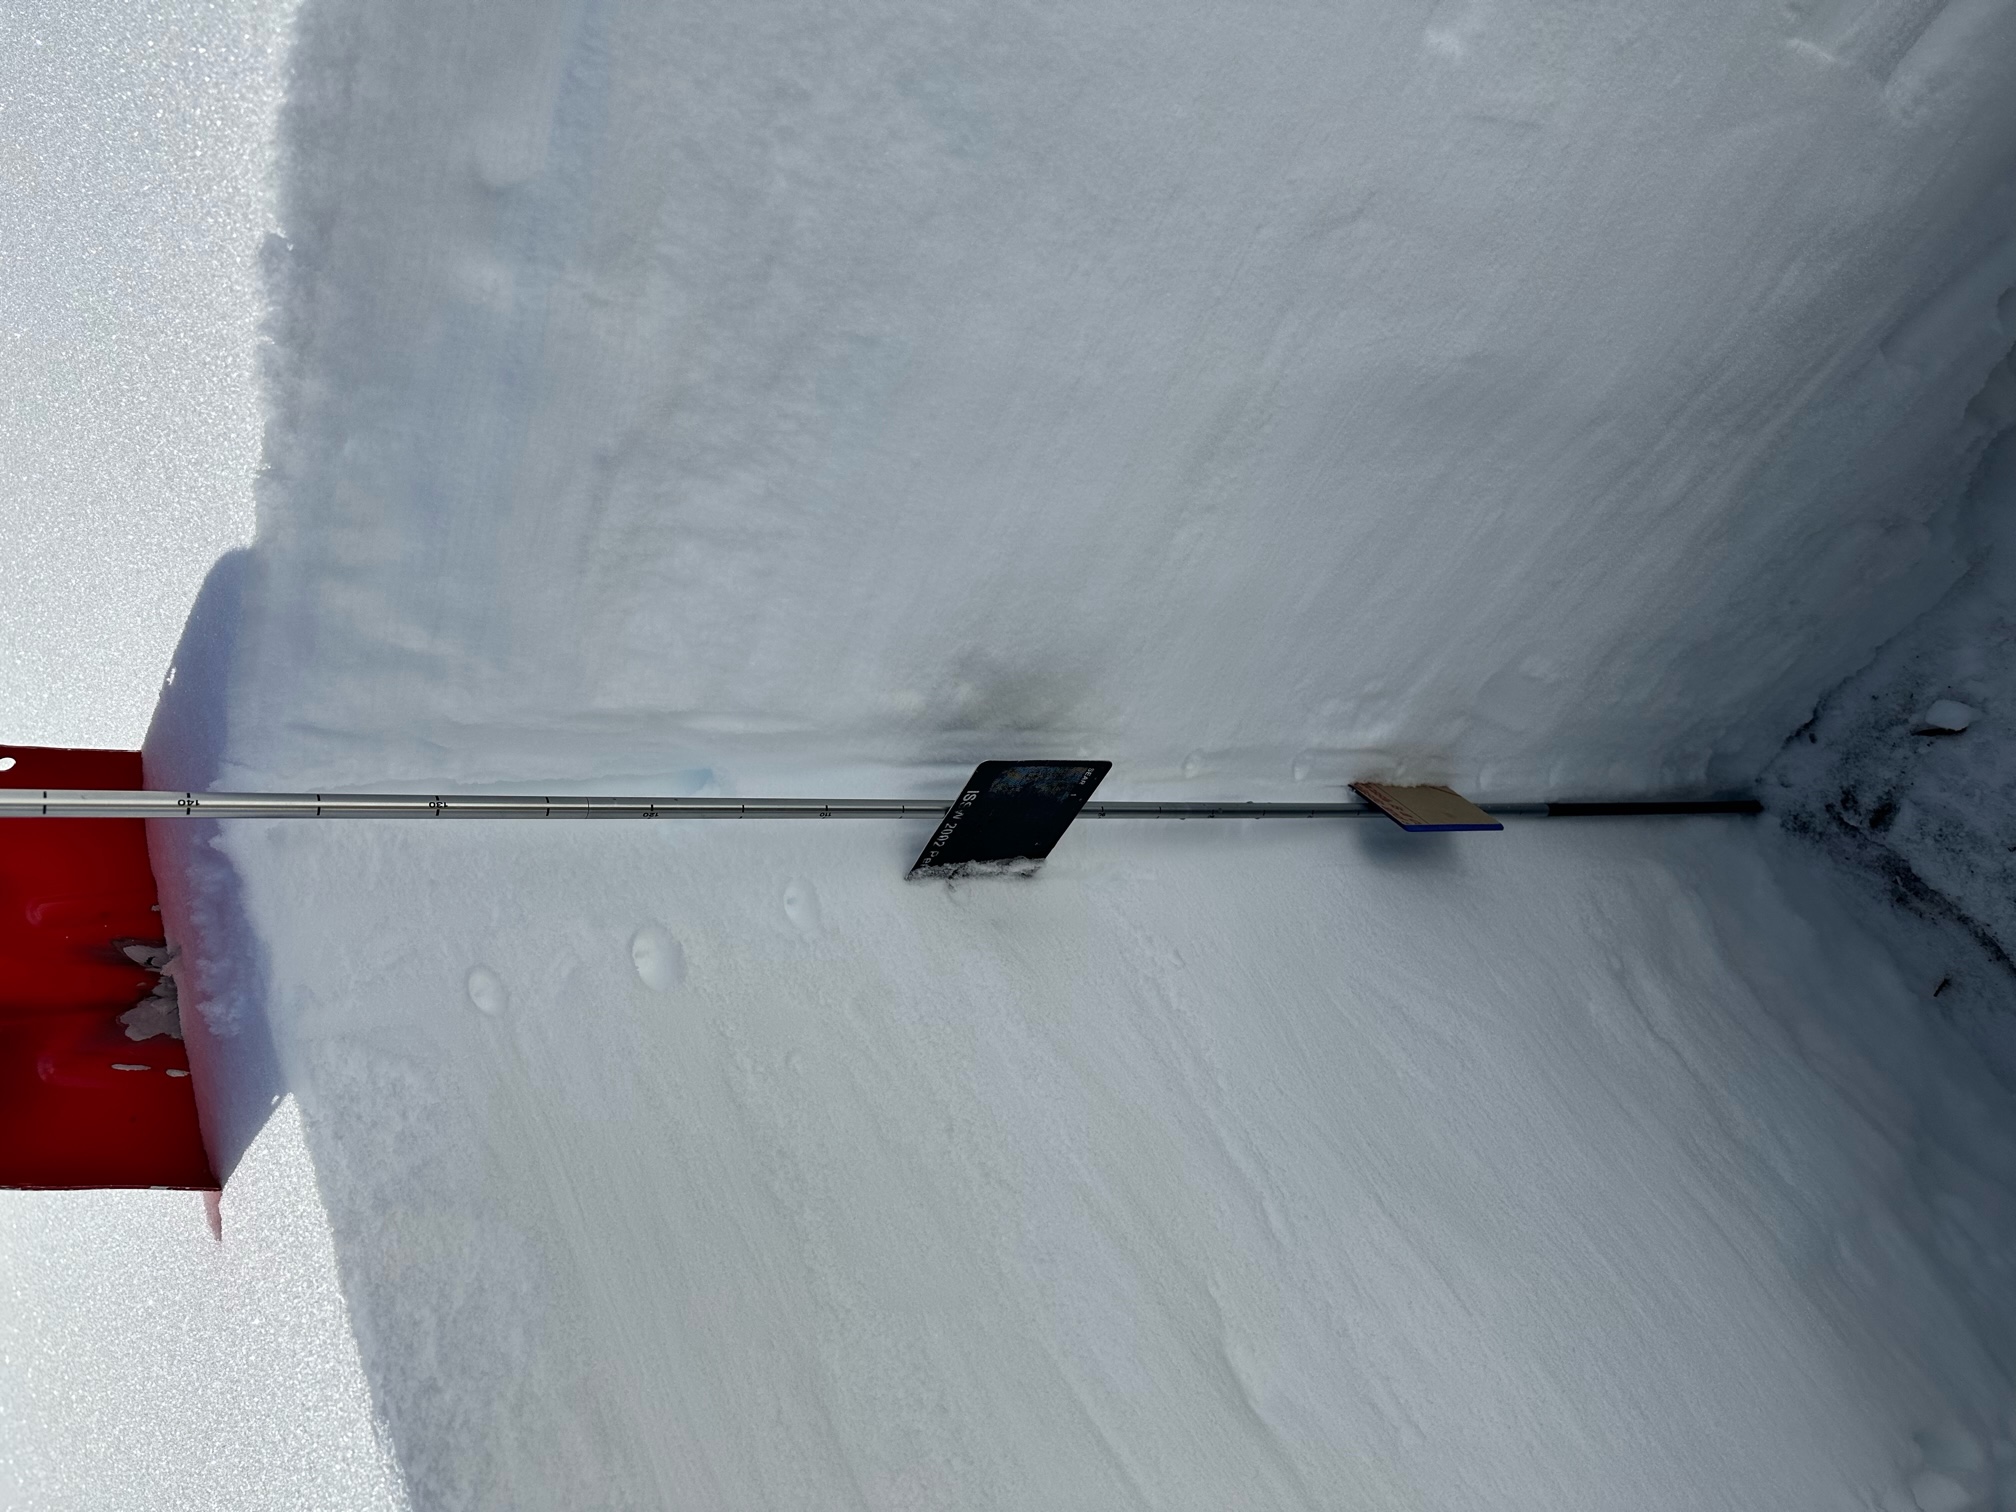
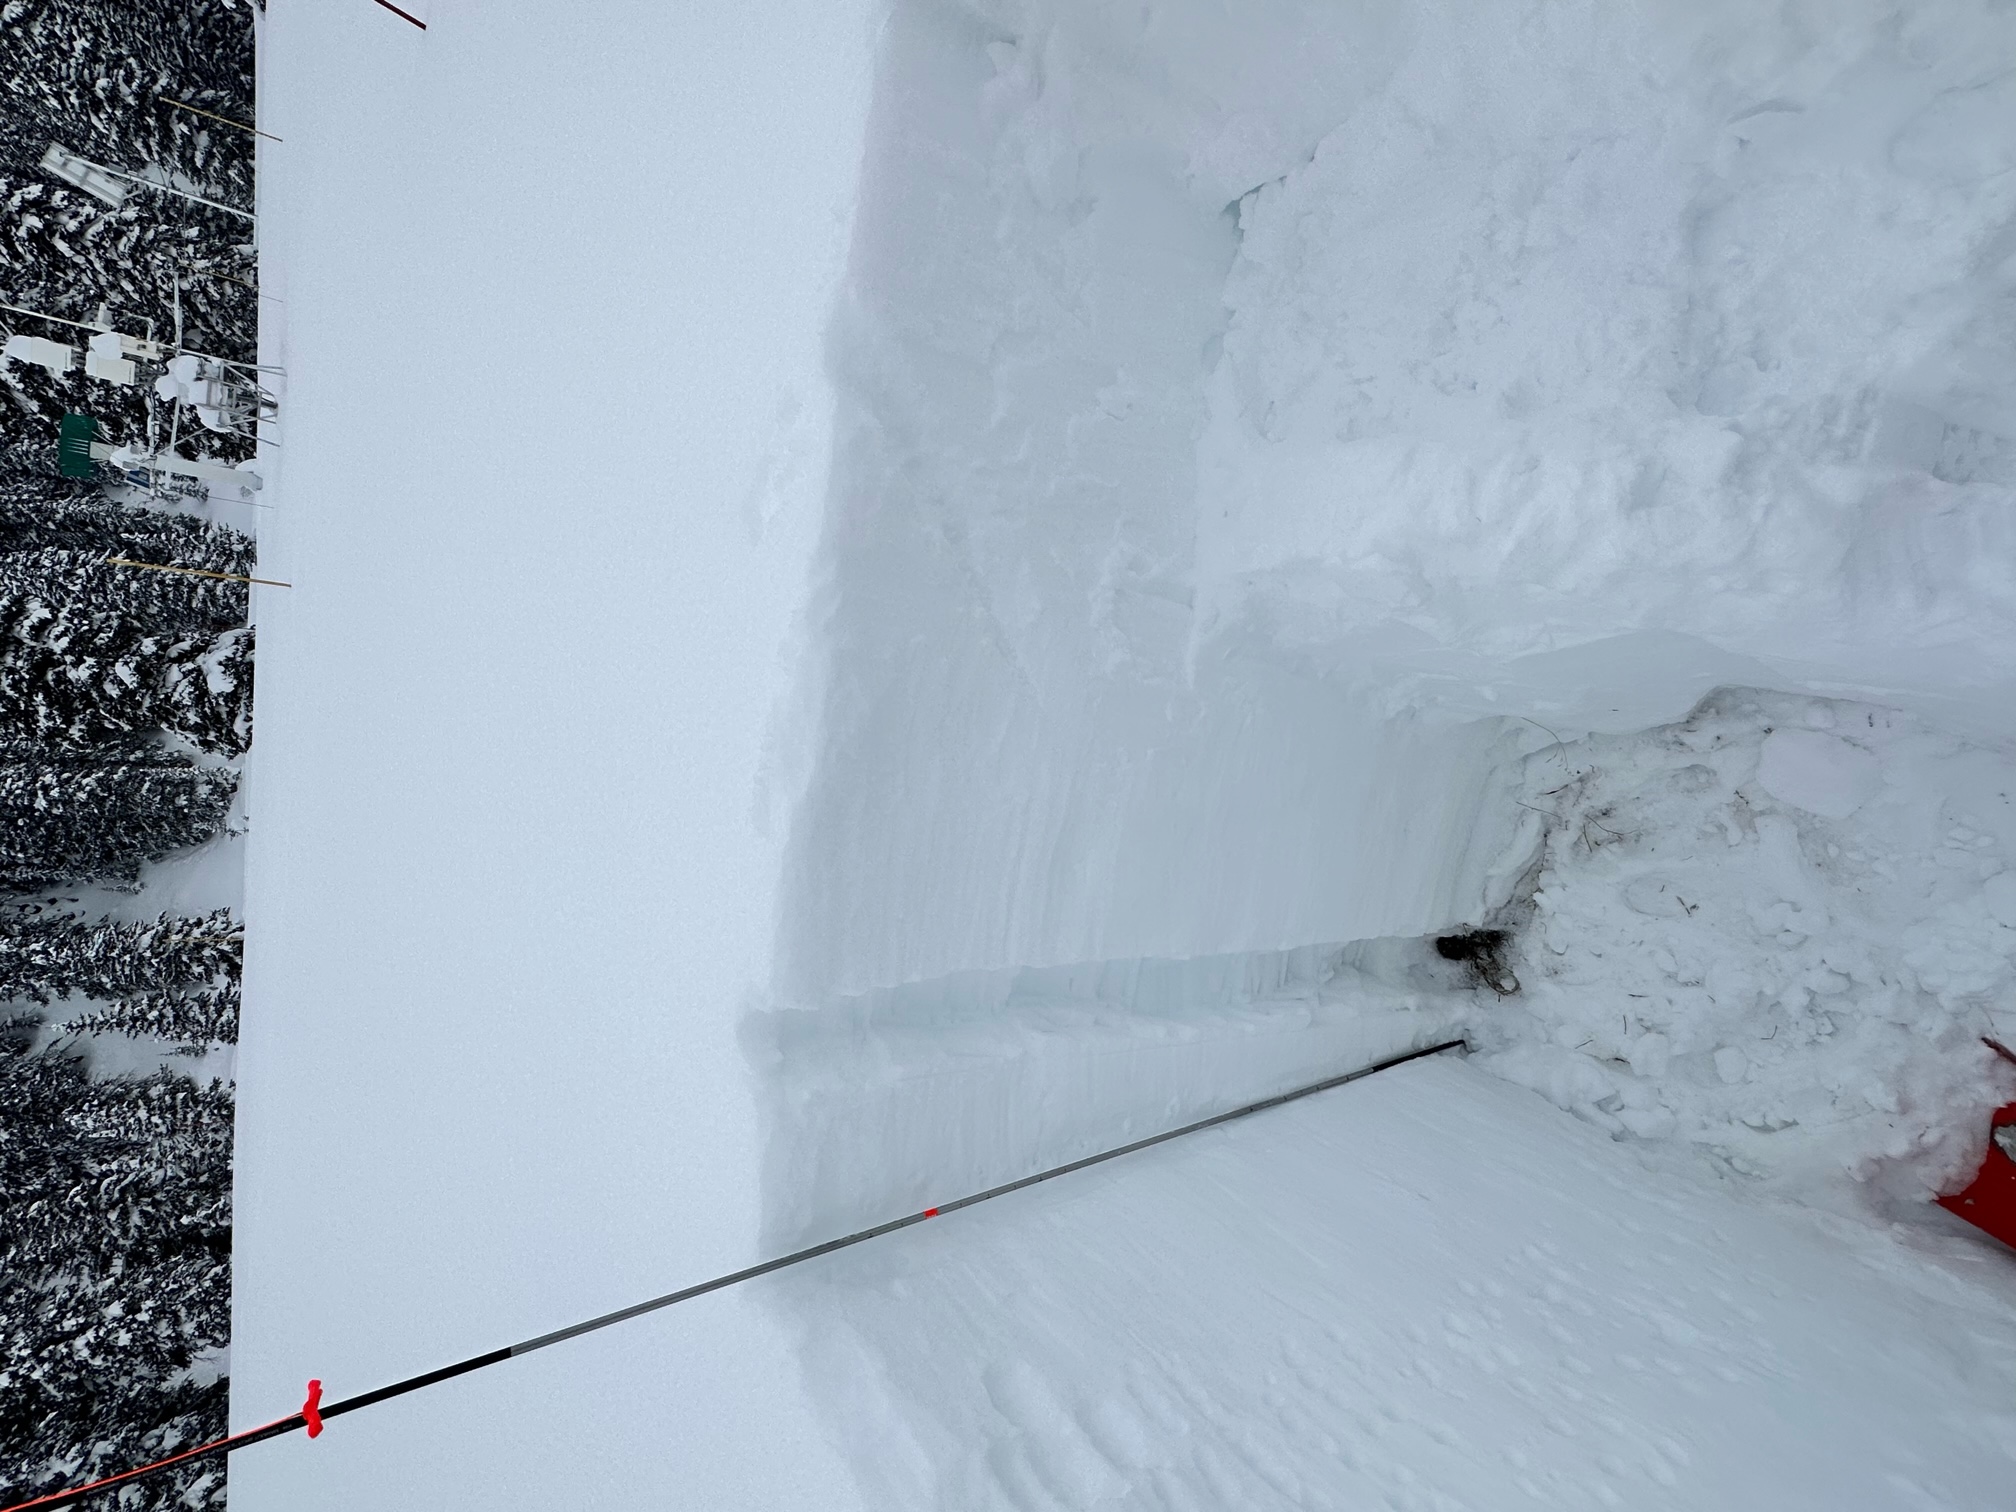
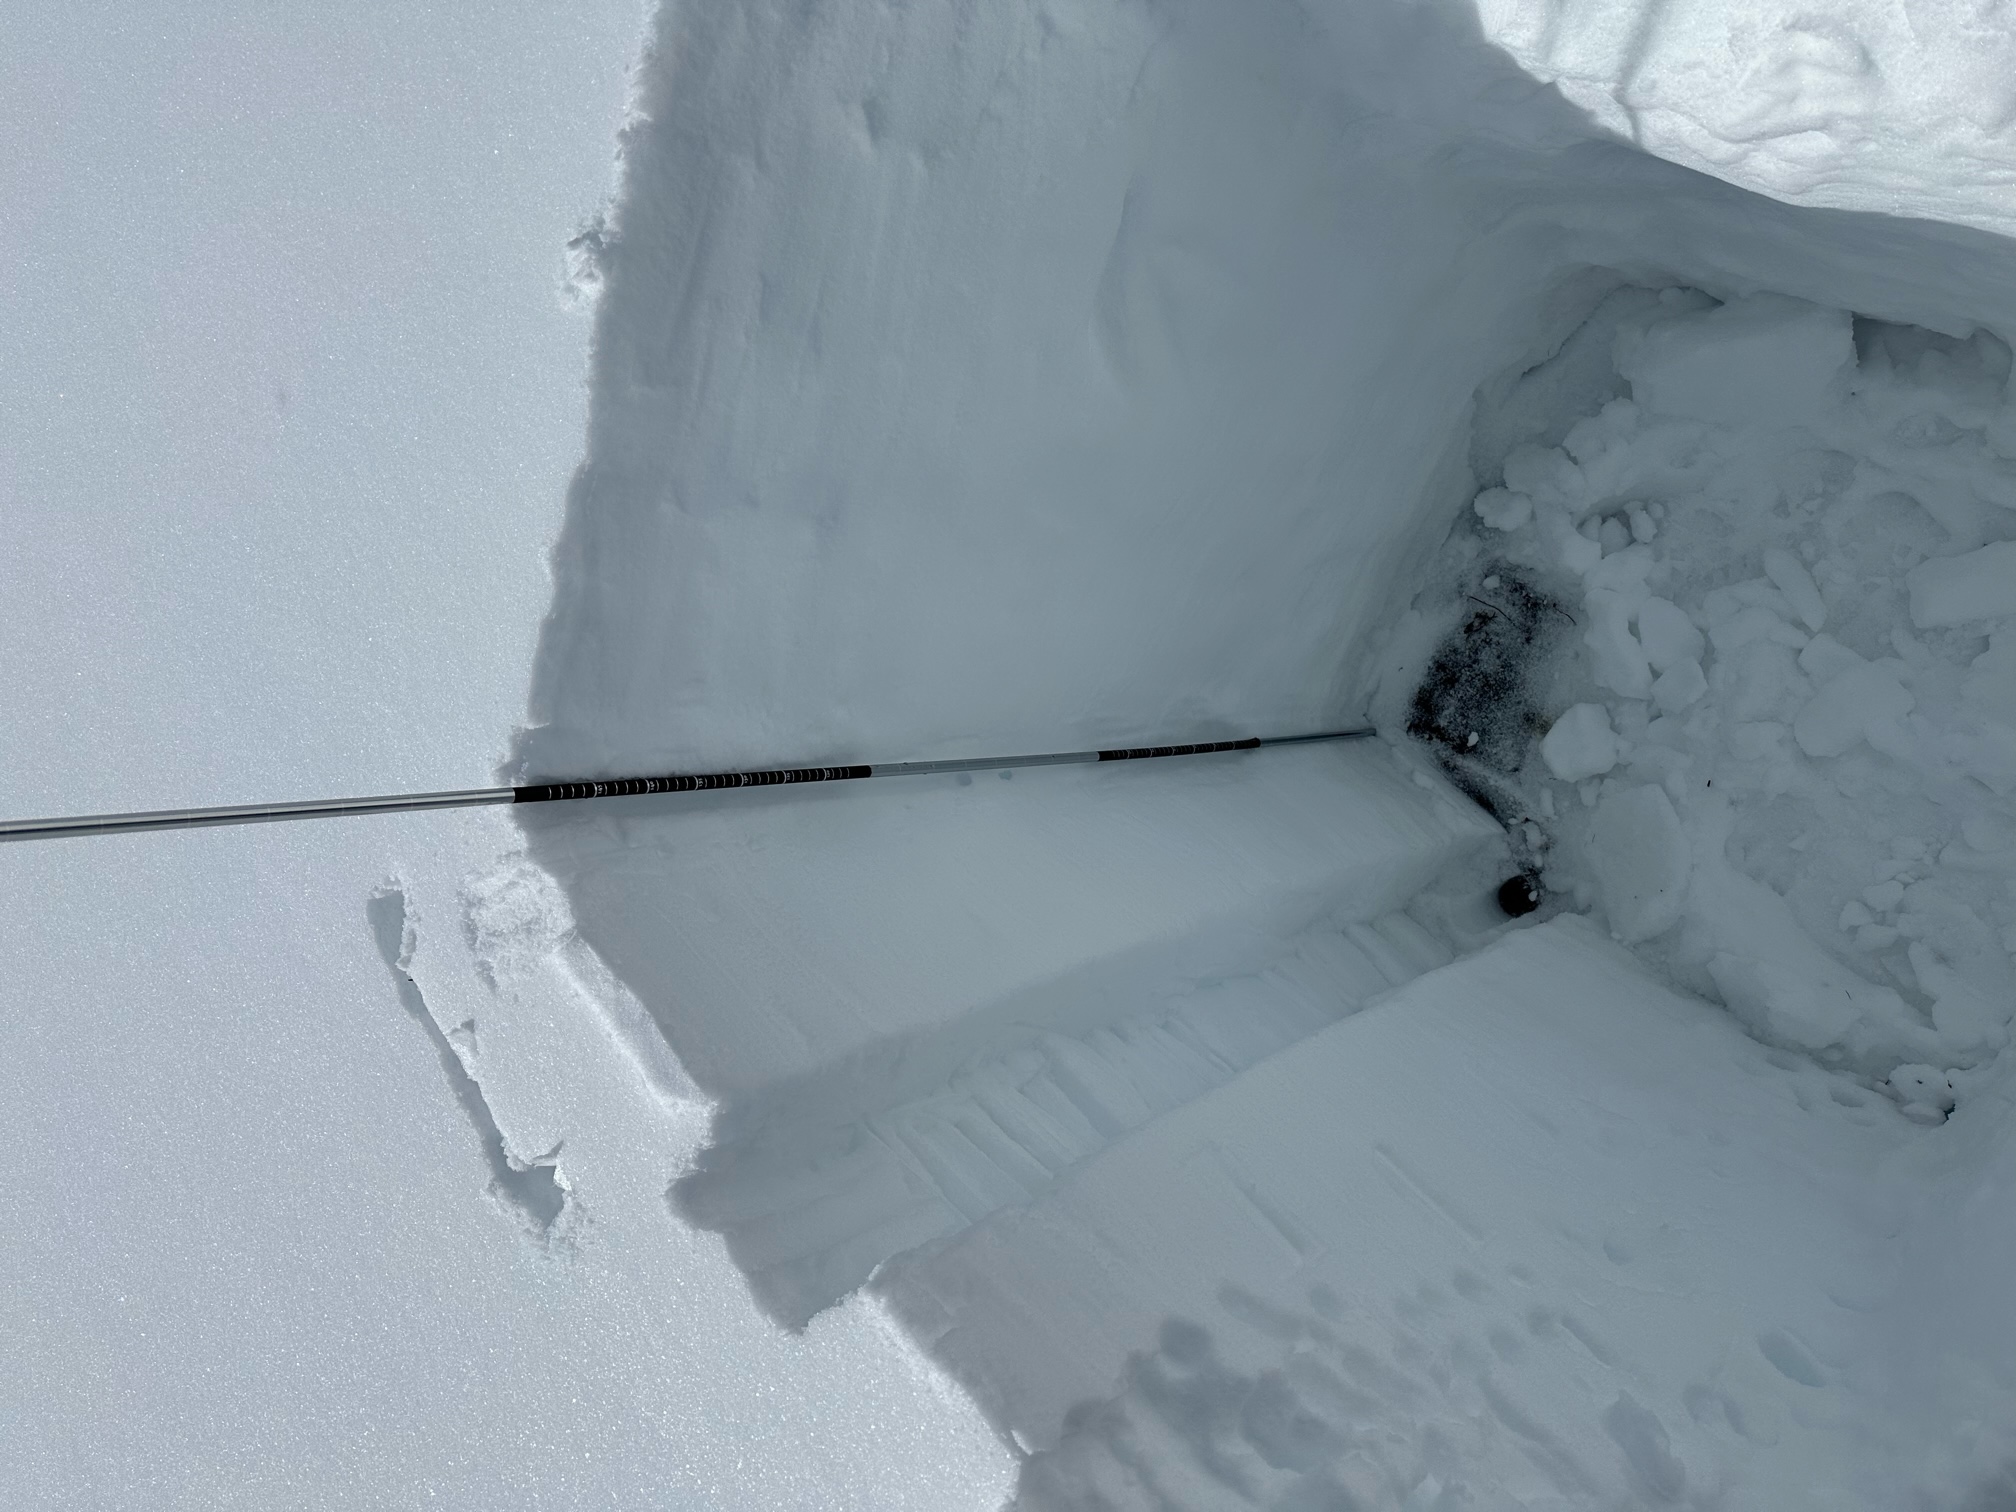
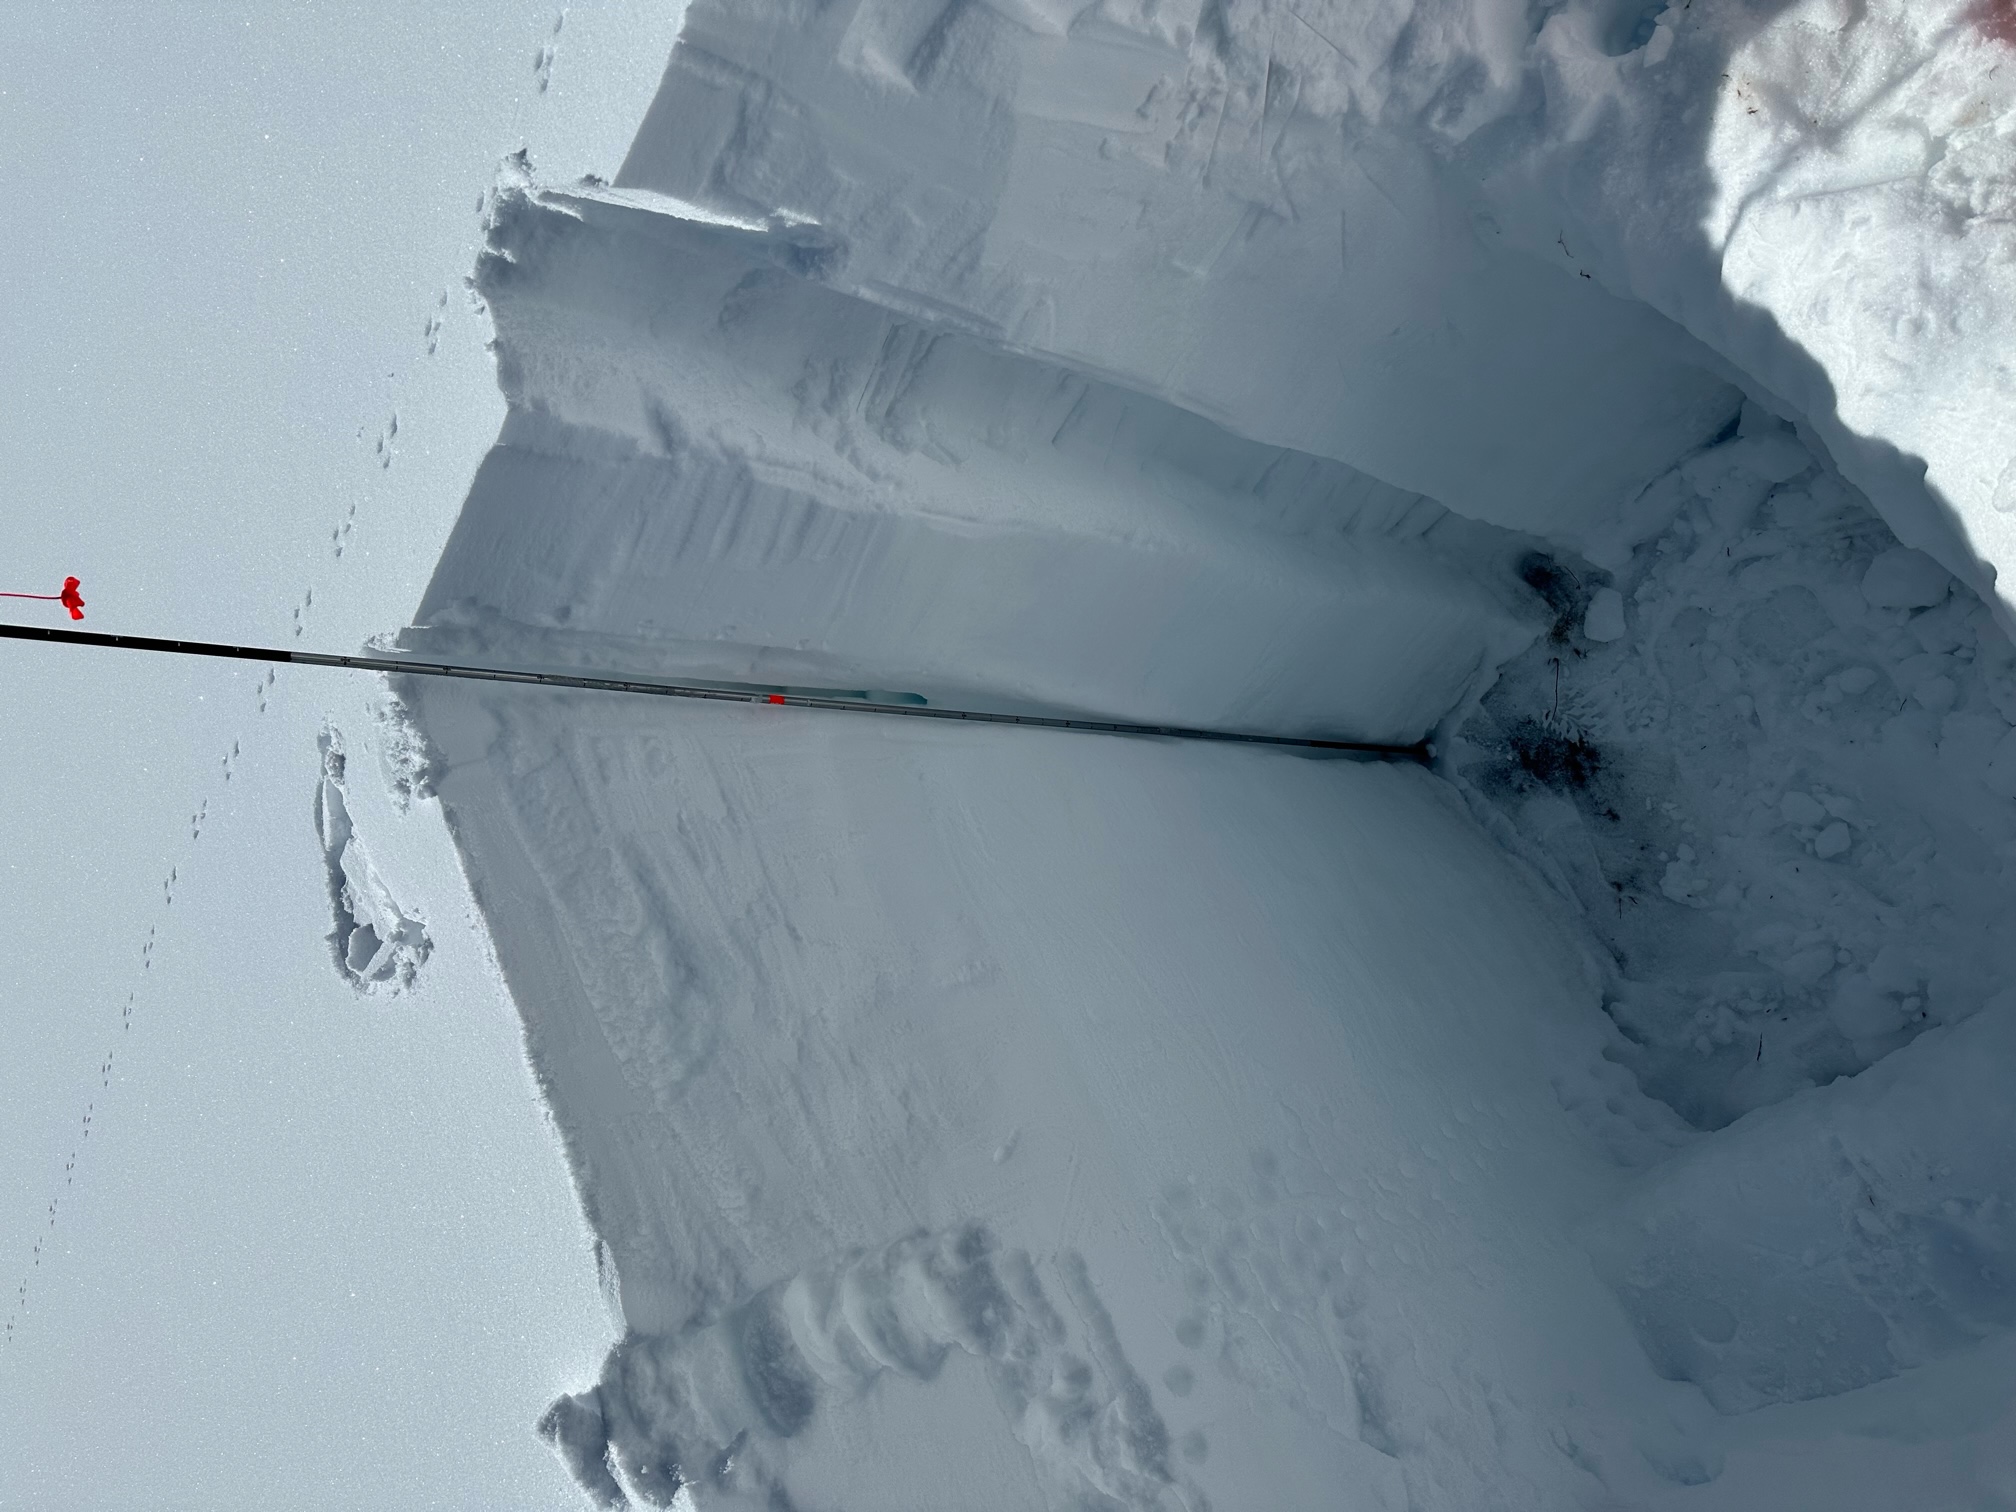
Dust-on-snow fieldwork photos available for publication. Please send requests for additional photos or for captions to jderry@snowstudies.org. All Photos © Center for Snow and Avalanche Studies
Click each photo for a larger version and for captions. Mouse over the large images to display captions, including the date of the photo.


